


FXOpen

Gold price rallied recently to a new 8-year high above $1,740 and it is currently correcting lower. Conversely, crude oil price is now showing signs of a bullish breakout above $27.00.
Important Takeaways for Gold and Oil
- Gold price surged towards the $1,750 level and it is currently correcting against the US Dollar.
- There was a break below a key contracting triangle with support near $1,720 on the hourly chart of gold.
- Crude oil price is currently showing a few recovery signs above the $25.00 support.
- There is a major bearish trend line forming with resistance near $26.85 on the hourly chart of XTI/USD.
Gold Price Technical Analysis
Earlier this week, gold price extended its rise above the $1,700 resistance area against the US Dollar. It even broke the $1,720 resistance area to continue higher.
Finally, the price traded close to the $1,750 resistance and formed a new 8-year high at $1,747 on FXOpen. The price is currently correcting lower and trading below the $1,725 support level and the 50 hourly simple moving average.
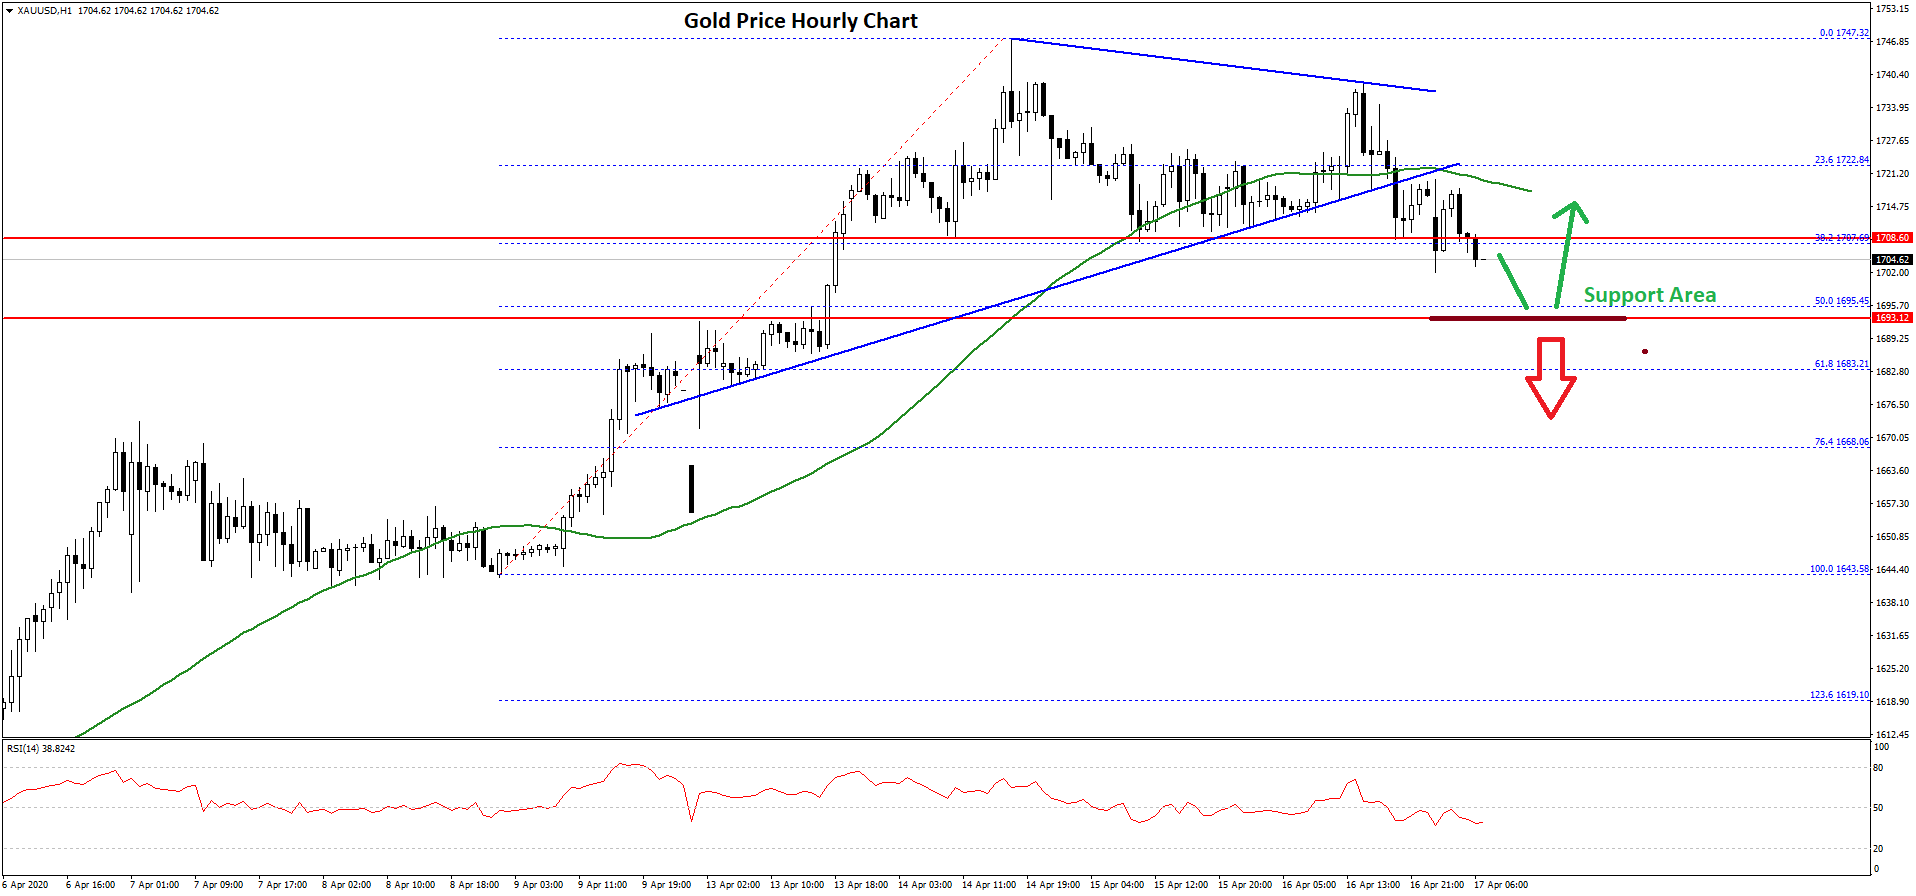
There was a break below the 38.2% Fib retracement level of the recent rally from the $1,643 low to $1,747 high. Moreover, there was a break below a key contracting triangle with support near $1,720 on the hourly chart of gold.
The price is now trading below the $1,710 level, with an immediate support near the $1,700 level. The first key support is near the $1,695 level since it is close to the 50% Fib retracement level of the recent rally from the $1,643 low to $1,747 high.
Any further losses may perhaps push the price back towards the $1,680 support level in the near term. On the upside, the previous support near the $1,720 level and the 50 hourly simple moving average could act as a hurdle.
To start a fresh increase, the price must gain bullish momentum above the $1,720 and $1,725 resistance levels. The main resistance on the upside is still near $1,750.
Oil Price Technical Analysis
Crude oil price remained in a bearish zone and traded below the $27.00 support against the US Dollar. The price even broke the $25.00 support and traded as low as $24.90.
It is currently correcting above the $25.00 and $25.50 levels. There was a break above the 23.6% Fib retracement level of the recent decline from the $29.24 high to $24.90 low.
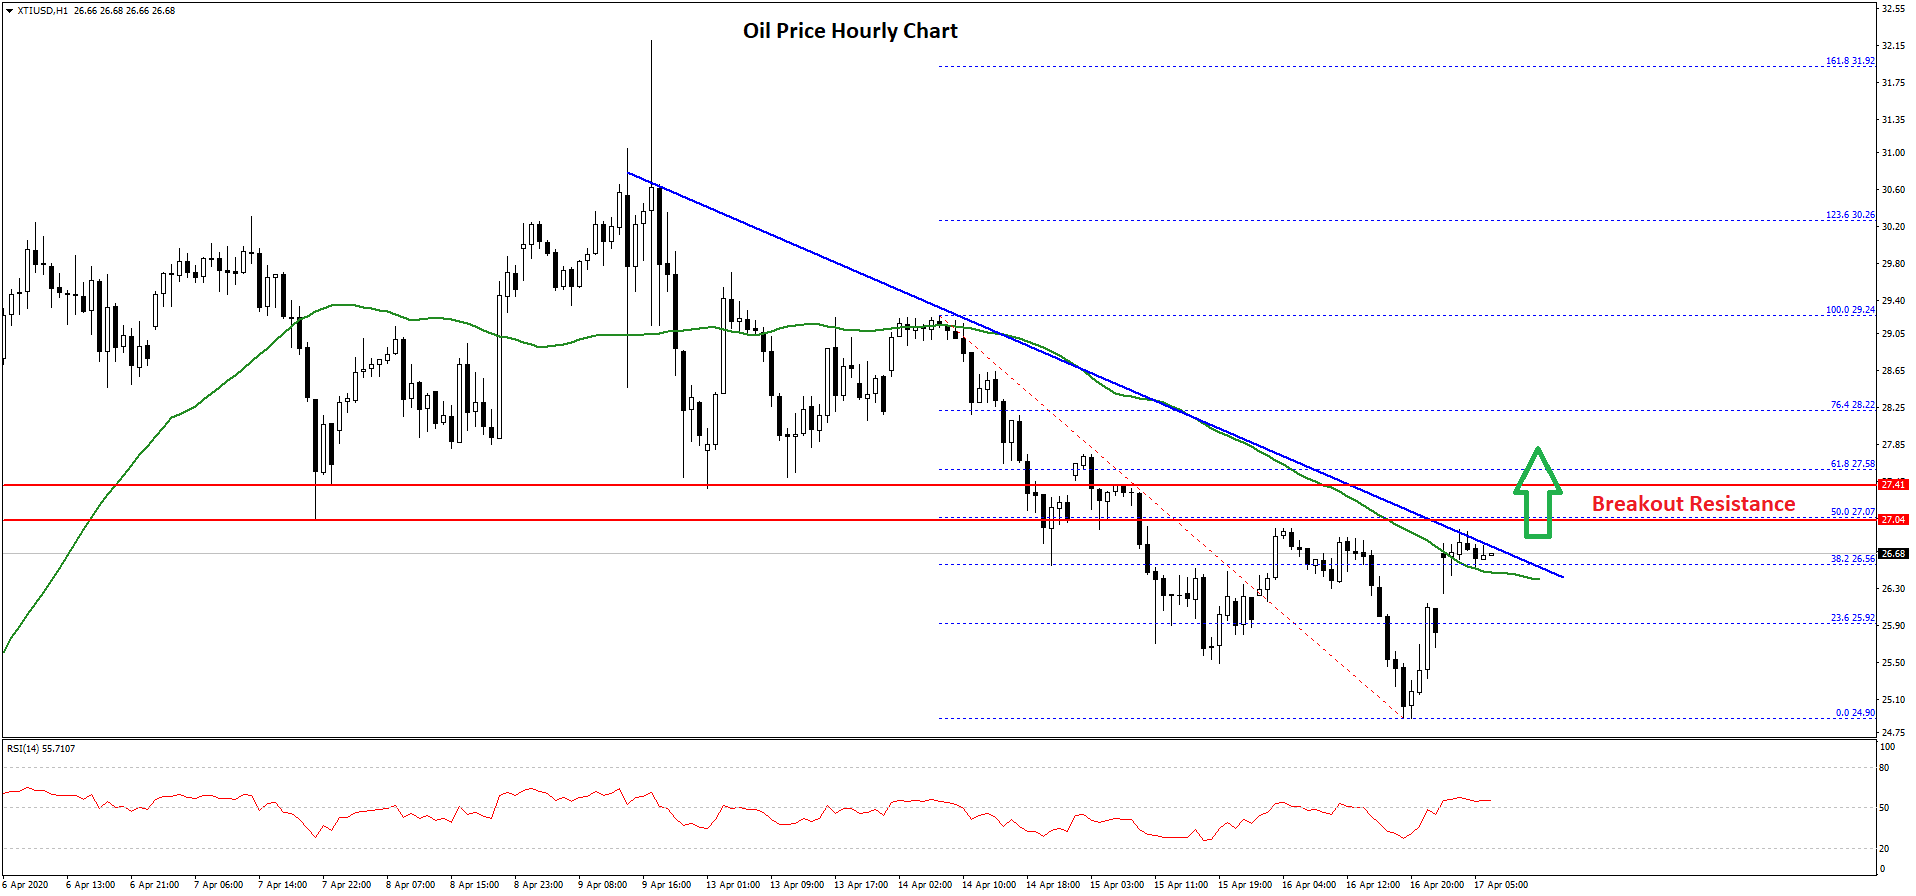
The price is now trading above the $26.00 level and the 50 hourly simple moving average. However, there is a key resistance forming near the $26.80 and $27.00 levels.
There is also a major bearish trend line forming with resistance near $26.85 on the hourly chart of XTI/USD. The 50% Fib retracement level of the recent decline from the $29.24 high to $24.90 low might also act as a hurdle near $27.07.
Therefore, oil price must surpass the $27.00 and $27.40 resistance levels to continue higher in the near term. The next major hurdle on the upside sits near the $28.20 and $28.50 levels.
Conversely, the price could resume its decline below the $26.00 level in the near term. ON the downside, the main support is near the $25.00 level, below which it could slide towards the $23.20 support area.
Trade over 50 forex markets 24 hours a day with FXOpen. Take advantage of low commissions, deep liquidity, and spreads from 0.0 pips. Open your FXOpen account now or learn more about trading forex with FXOpen.
This article represents the opinion of the Companies operating under the FXOpen brand only. It is not to be construed as an offer, solicitation, or recommendation with respect to products and services provided by the Companies operating under the FXOpen brand, nor is it to be considered financial advice.
Latest from Forex Analysis
Latest articles

Google Share Price Rose Post-market to a New All-time Record
Yesterday, after the close of the main trading session, a report on activities for the 1st quarter of Alphabet Inc. (Google's parent company) was published. The report was strong, exceeding investors' expectations.
→ Quarterly EPS = USD 1.89 (expected = USD 1.

S&P 500 Rebounds after Negative GDP News
Data released yesterday showed US GDP growth slowed to 1.6% in the first quarter of the year. According to ForexFactory: forecast = 2.2%, past value = 2.4%.
Reaction to the news sent the S&P 500 mini stock

GBP/USD And USD/CAD Daily Chart Outlook
GBP/USD is attempting a recovery wave from 1.2300. USD/CAD is consolidating and might aim for a move above the 1.3760 resistance zone.
Important Takeaways for GBP/USD and USD/CAD Analysis Today
· The British Pound started