


FXOpen

Gold price is trading nicely in a positive zone above the $1,475 support area. Crude oil price is also showing positive signs and it could continue to rise above $59.00 and $60.00.
Important Takeaways for Gold and Oil
- Gold price rallied recently above the $1,460 and $1,475 resistance levels against the US Dollar.
- There is a contracting triangle forming with resistance near $1,478 on the hourly chart of gold.
- Crude oil price remains well supported above the $57.00 and $57.60 levels.
- There was a break above a major bearish trend line with resistance near $57.15 on the hourly chart of XTI/USD.
Gold Price Technical Analysis
Earlier this week, gold price formed a strong support near the $1,452 and $1,453 levels against the US Dollar. As a result, there was a nice upward move above the $1,460 and $1,470 resistance levels.
Moreover, there was a break below the $1,475 resistance and 50 hourly simple moving average. Finally, there was a break above the $1,480 level and the price traded as high as $1,483 on FXOpen.
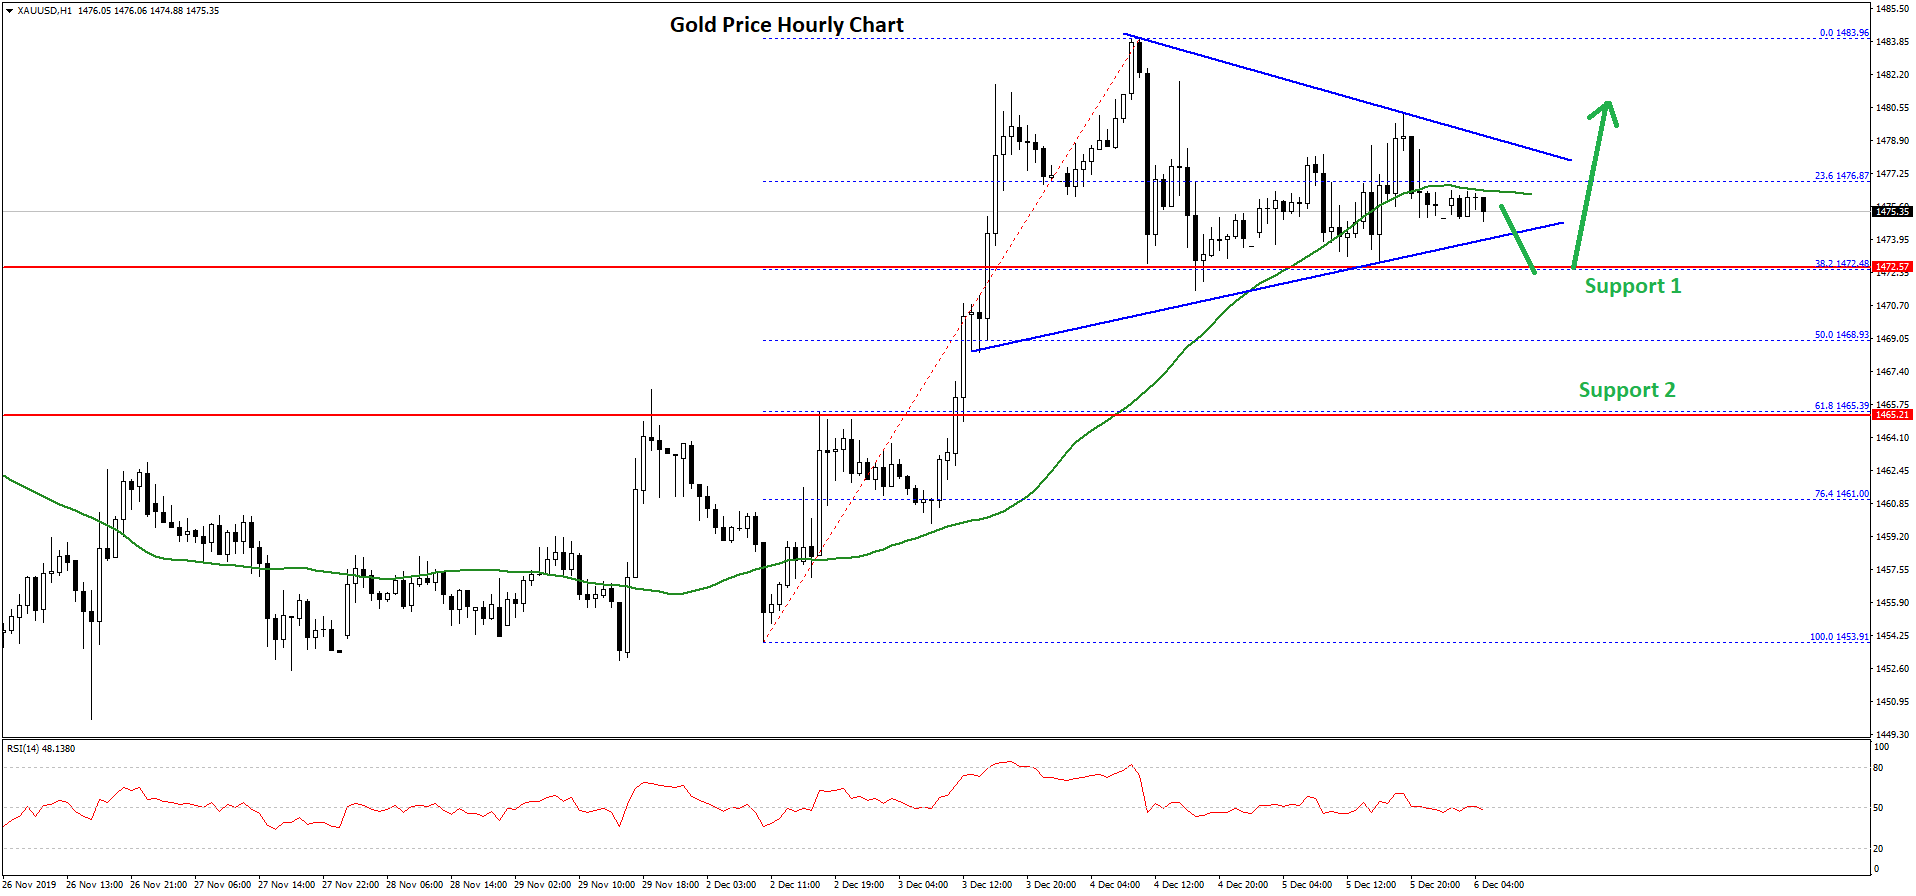
Recently, there was a downside correction below the $1,480 and $1,478 levels. The price traded below the 23.6% Fib retracement level of the upward move from the $1,453 low to $1,483 high.
However, the price is holding the $1,472 and $1,470 support levels. Besides, it seems like the 38.2% Fib retracement level of the upward move from the $1,453 low to $1,483 high is providing support.
More importantly, there is a contracting triangle forming with resistance near $1,478 on the hourly chart of gold. If there is an upside break above the $1,478 and $1,480 resistance levels, the price is likely to continue higher.
The next major resistance is near the $1,485 level, above which gold price may perhaps rise towards the $1,500 level in the near term.
On the downside, an initial support is near the $1,472 level. If gold price fails to stay above the $1,472 support, there are chances of a push towards the $1,465 support area.
Oil Price Technical Analysis
This week, there was a nice upward move in crude oil price from the $55.40 support area against the US Dollar. The price even climbed above the $56.50 resistance area to move into a positive zone.
Furthermore, there was a break above the $57.00 hurdle and the 50 hourly simple moving average. More importantly, there was a break above a major bearish trend line with resistance near $57.15 on the hourly chart of XTI/USD.
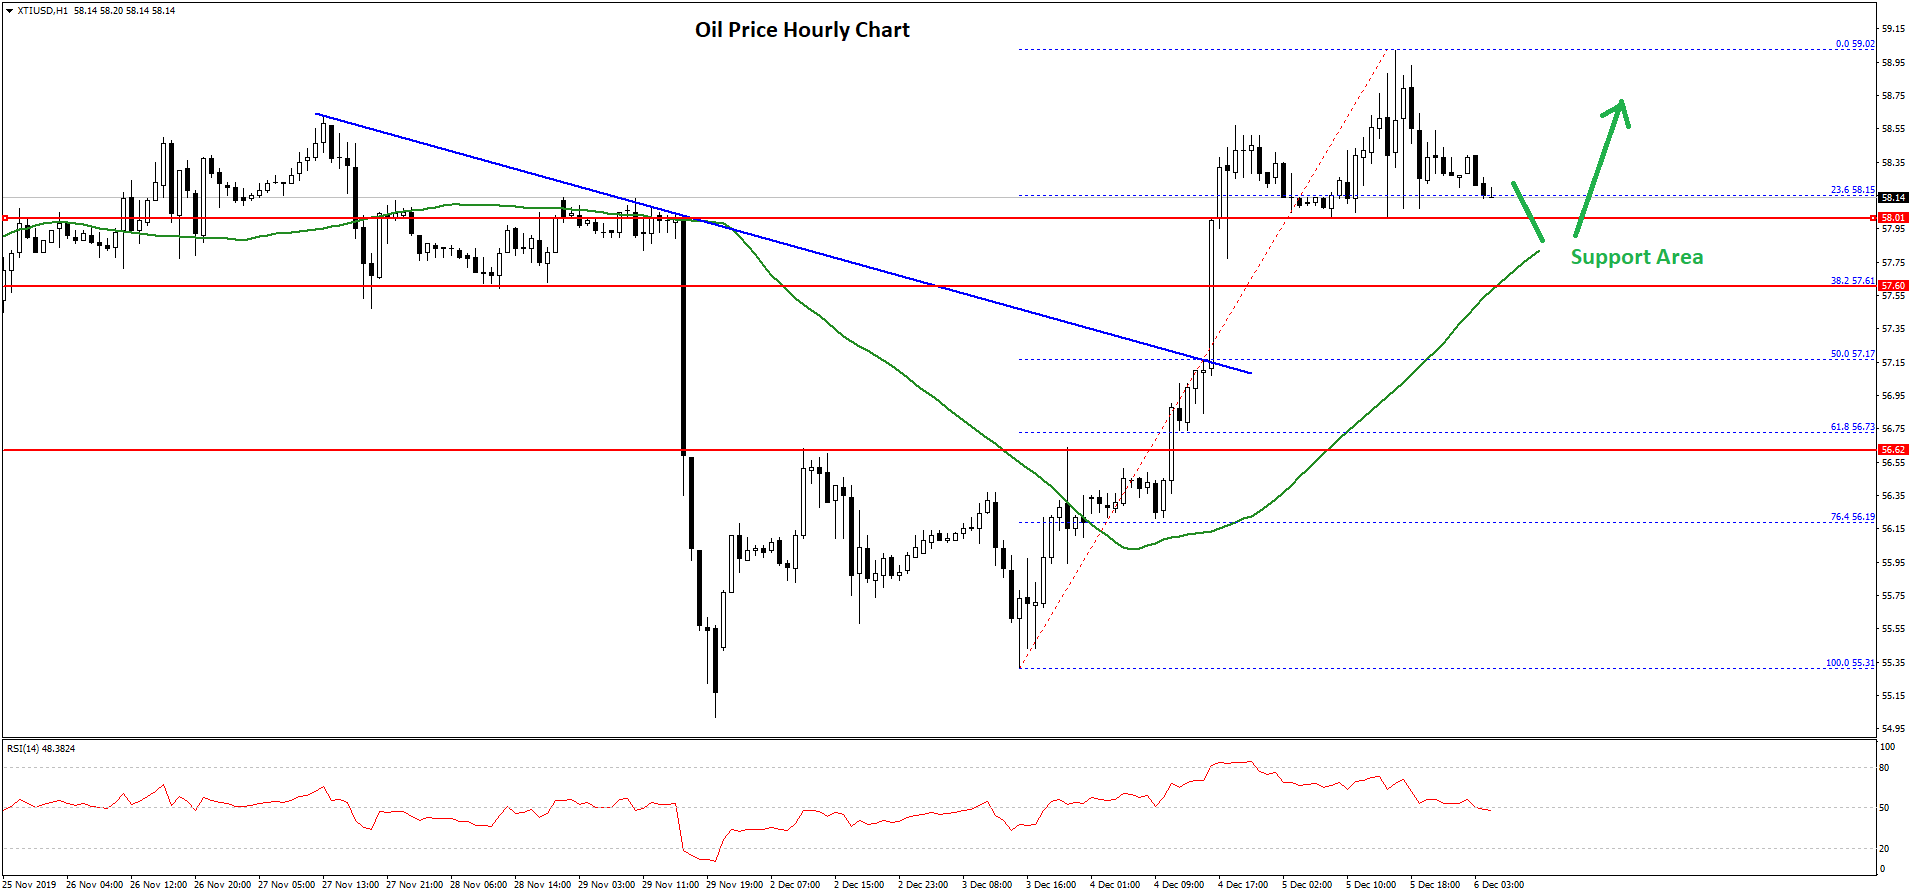
It opened the doors for more gains above the $58.00 level. The price traded as high as $56.02 and it is currently correcting lower. It is testing the 23.6% Fib retracement level of the recent wave from the $55.31 low to $59.02 high.
On the downside, there are many supports near $57.75, $57.70 and $57.60. The 50 hourly simple moving average is also near the $57.75 level.
Besides, the 38.2% Fib retracement level of the recent wave from the $55.31 low to $59.02 high is near $57.17. If there are more downsides, the price could revisit the $57.00 support area.
Conversely, crude oil price could resume its upward move above the $58.50 and $59.00 resistance levels in the near term.
Trade over 50 forex markets 24 hours a day with FXOpen. Take advantage of low commissions, deep liquidity, and spreads from 0.0 pips. Open your FXOpen account now or learn more about trading forex with FXOpen.
This article represents the opinion of the Companies operating under the FXOpen brand only. It is not to be construed as an offer, solicitation, or recommendation with respect to products and services provided by the Companies operating under the FXOpen brand, nor is it to be considered financial advice.
Latest from Forex Analysis
Latest articles

Weekly Market Wrap With Gary Thomson: UK100, USD, GOLD, OIL
Get the latest scoop on the week's hottest headlines, all in one convenient video. Join Gary Thomson, the COO of FXOpen UK, as he breaks down the most significant news reports and shares his expert insights.
- UK100 Share Index Rises

What Is a Darvas Box Theory and How Does It Work in Trading?
The Darvas Box Theory, pioneered by Nicolas Darvas in the 1950s, has transcended its stock market origins to become a valuable tool for forex traders. This method leverages specific price movements and patterns, known as the Darvas Box, to track

NFLX Stock Price Falls Despite Subscriber Growth
Yesterday, after the close of the main trading session on the stock market, Netflix reported to investors for the 1st quarter of 2024.
The report turned out better than expected:
→ earnings per share: actual = USD 5.28, forecast = USD 4.