


FXOpen

Gold price climbed higher once again, but it failed to surpass the $1,437 resistance area. Crude oil price is currently correcting higher, but it is facing a lot of hurdles on the upside.
Important Takeaways for Gold and Oil
- Gold price started a downside correction after topping near the $1,437 level against the US Dollar.
- There is a major bullish trend line forming with support near $1,415 on the hourly chart of gold.
- Crude oil price started a decent recovery after it tested the key $56.00 support area.
- There is a key bearish trend line forming with resistance near $56.80 on the hourly chart of XTI/USD.
Gold Price Technical Analysis
Gold price gained traction this week and climbed above the $1,410 and $1,420 resistance levels against the US Dollar. The price even broke the $1,430 resistance level, but it struggled to climb further higher.
A swing high was formed near $1,437 on FXOpen and the price recently started a downside correction. It broke the $1,425 and $1,420 support levels. It tested the $1,410 level and it is currently recovering higher.
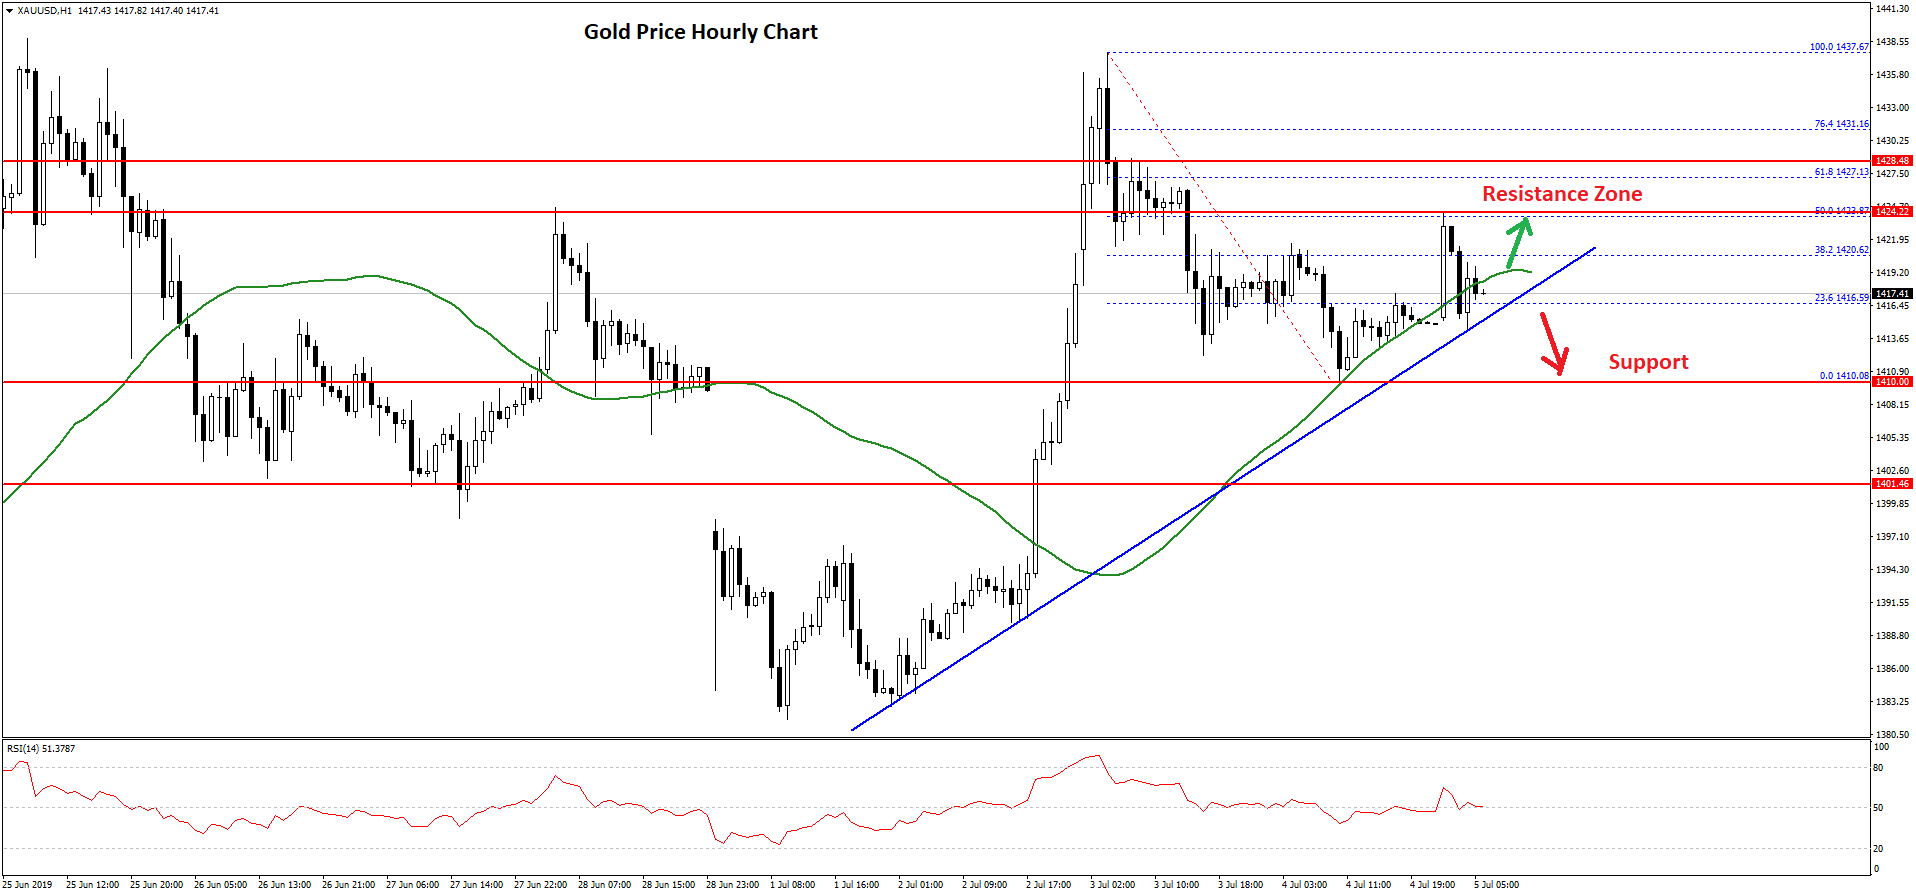
There was a break above the 23.6% Fib retracement level of the recent decline from the $1,437 high to $1,410 low. The price remained above the $1,415 level and the 50 hourly simple moving average.
However, the price struggled to clear the $1,425 resistance plus the 50% Fib retracement level of the recent decline from the $1,437 high to $1,410 low.
At the moment, the price is trading just above the $1,415 support area. There is also a major bullish trend line forming with support near $1,415 on the hourly chart of gold. If there is a downside break below the trend line and the 50 hourly simple moving average, the price could revisit the $1,410 support area.
On the upside, there is a strong resistance near the $1,422 and $1,425 levels. If there is a break above the $1,425 resistance, the price could accelerate above the $1,430 level in the near term.
Oil Price Technical Analysis
After topping near the $60.20 level, crude oil price started a strong decline against the US Dollar. The price broke the $59.50 and $58.00 support levels to move into a bearish zone.
The decline was such that the price settled below the $57.50 support and 50 hourly simple moving average. It traded close to the $56.00 support area and a swing low was formed near the $56.09.
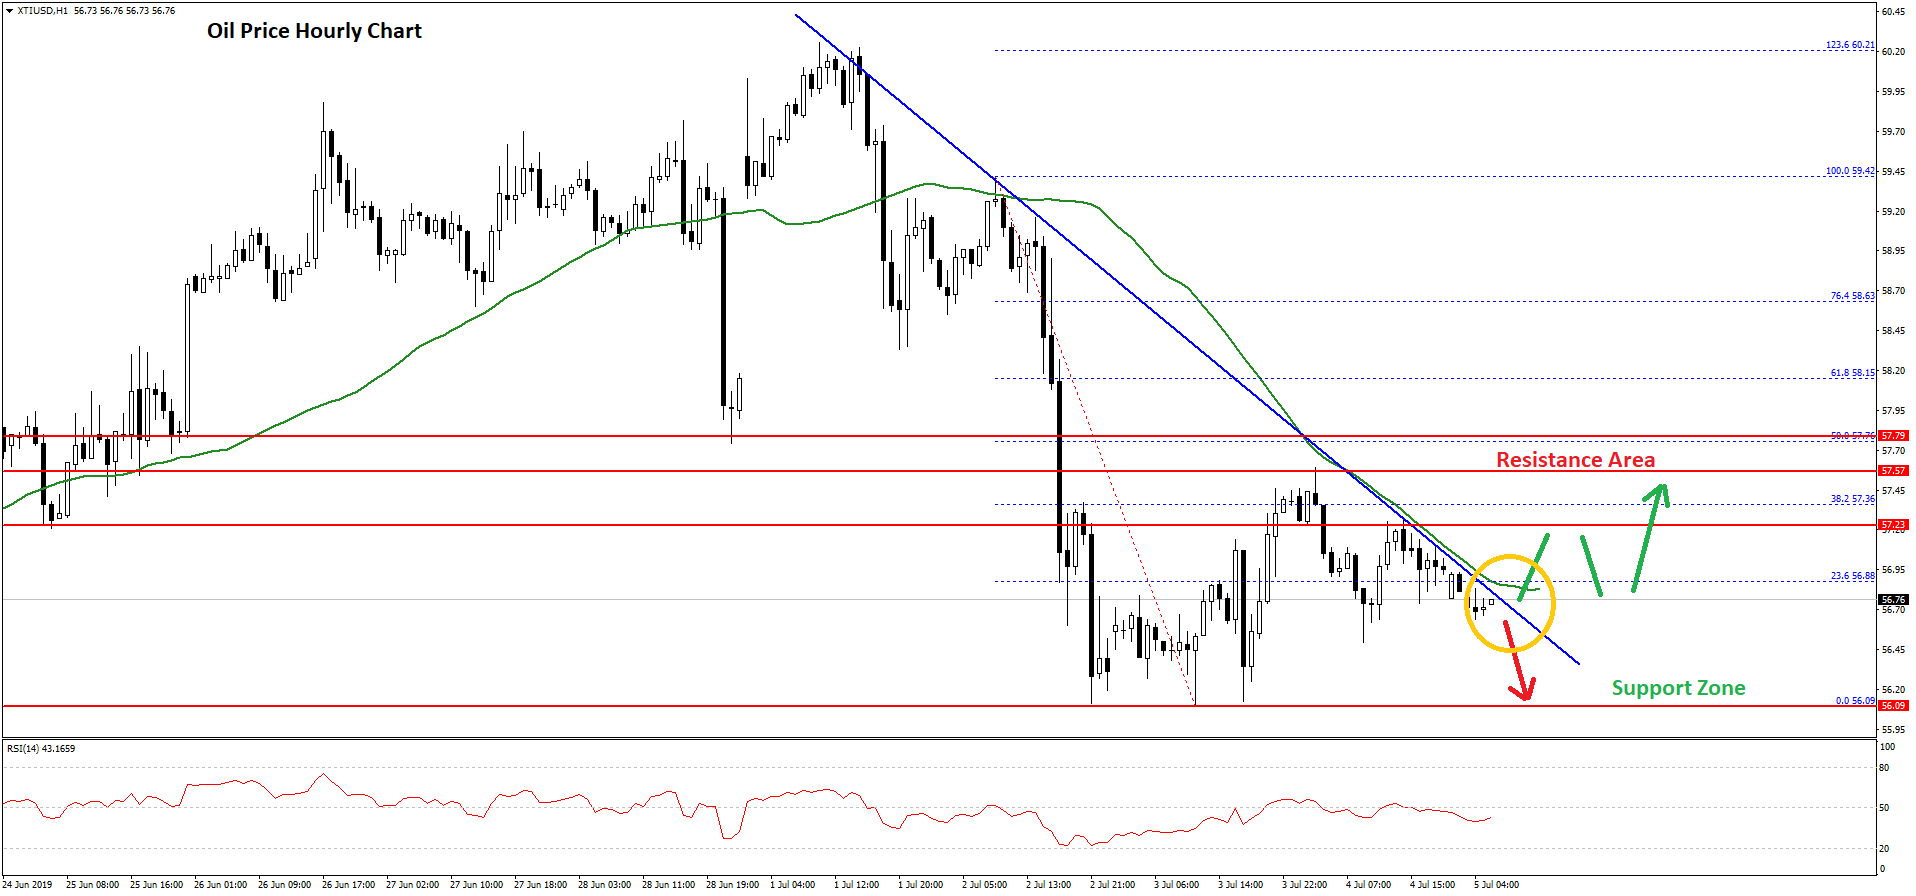
Recently, it corrected higher above the $56.50 resistance and the 23.6% Fib retracement level of the recent decline from the $59.42 high to $56.09 low. However, the upside move was capped by the $57.50 resistance.
Moreover, the price failed to test the 50% Fib retracement level of the recent decline from the $59.42 high to $56.09 low. There is also a key bearish trend line forming with resistance near $56.80 on the hourly chart of XTI/USD.
If there is an upside break above the trend line and the 50 hourly SMA, the price could recover towards the $57.50 or $58.00 resistance.
On the downside, the main supports are near $56.40 and $56.10, below which crude oil price might decline sharply below $56.00. The next major support is near the $55.00 level.
Trade over 50 forex markets 24 hours a day with FXOpen. Take advantage of low commissions, deep liquidity, and spreads from 0.0 pips. Open your FXOpen account now or learn more about trading forex with FXOpen.
This article represents the opinion of the Companies operating under the FXOpen brand only. It is not to be construed as an offer, solicitation, or recommendation with respect to products and services provided by the Companies operating under the FXOpen brand, nor is it to be considered financial advice.
Latest from Forex Analysis
Latest articles
Market Analysis: AUD/USD and NZD/USD Turn Red
AUD/USD declined below the 0.6500 and 0.6455 support levels. NZD/USD is also moving lower and might struggle to recover above 0.5950.
Important Takeaways for AUD/USD and NZD/USD Analysis Today
· The Aussie Dollar started

Since the Start of the Week, Brent Oil Price Has Dropped over 4%
At the beginning of the week, March 15, we wrote that the price of Brent oil could form a correction from the resistance level of USD 91 per barrel. Since then, the price has decreased by more than 4% due

Fair Value Gaps vs Liquidity Voids in Trading
Understanding fair value gaps and liquidity voids is essential for traders seeking to navigate the complexities of the financial markets. These concepts, deeply rooted in the Smart Money Concept (SMC), provide valuable insights into the dynamics of supply and demand,