


FXOpen

Gold price is trading with a bullish bias above the $1,472 support area. Crude oil price is trading in a strong uptrend and it could continue to rise above the $61.50 resistance.
Important Takeaways for Gold and Oil
- Gold price settled above the $1,470 and $1,472 support levels against the US Dollar.
- There is a major bullish trend line forming with support near $1,475 on the hourly chart of gold.
- Crude oil price is following a significant uptrend above the $60.00 support area.
- There is a crucial bullish trend line forming with support near $60.90 on the hourly chart of XTI/USD.
Gold Price Technical Analysis
In the past few days, gold price remained in a positive zone above the $1,460 support area against the US Dollar. As a result, there was a slow and steady rise above the $1,470 and $1,475 resistance levels.
There was also a close above the $1,472 level and the 50 hourly simple moving average. However, the price struggled to gain momentum above $1,480 and the recent high was near $1,481 on FXOpen.
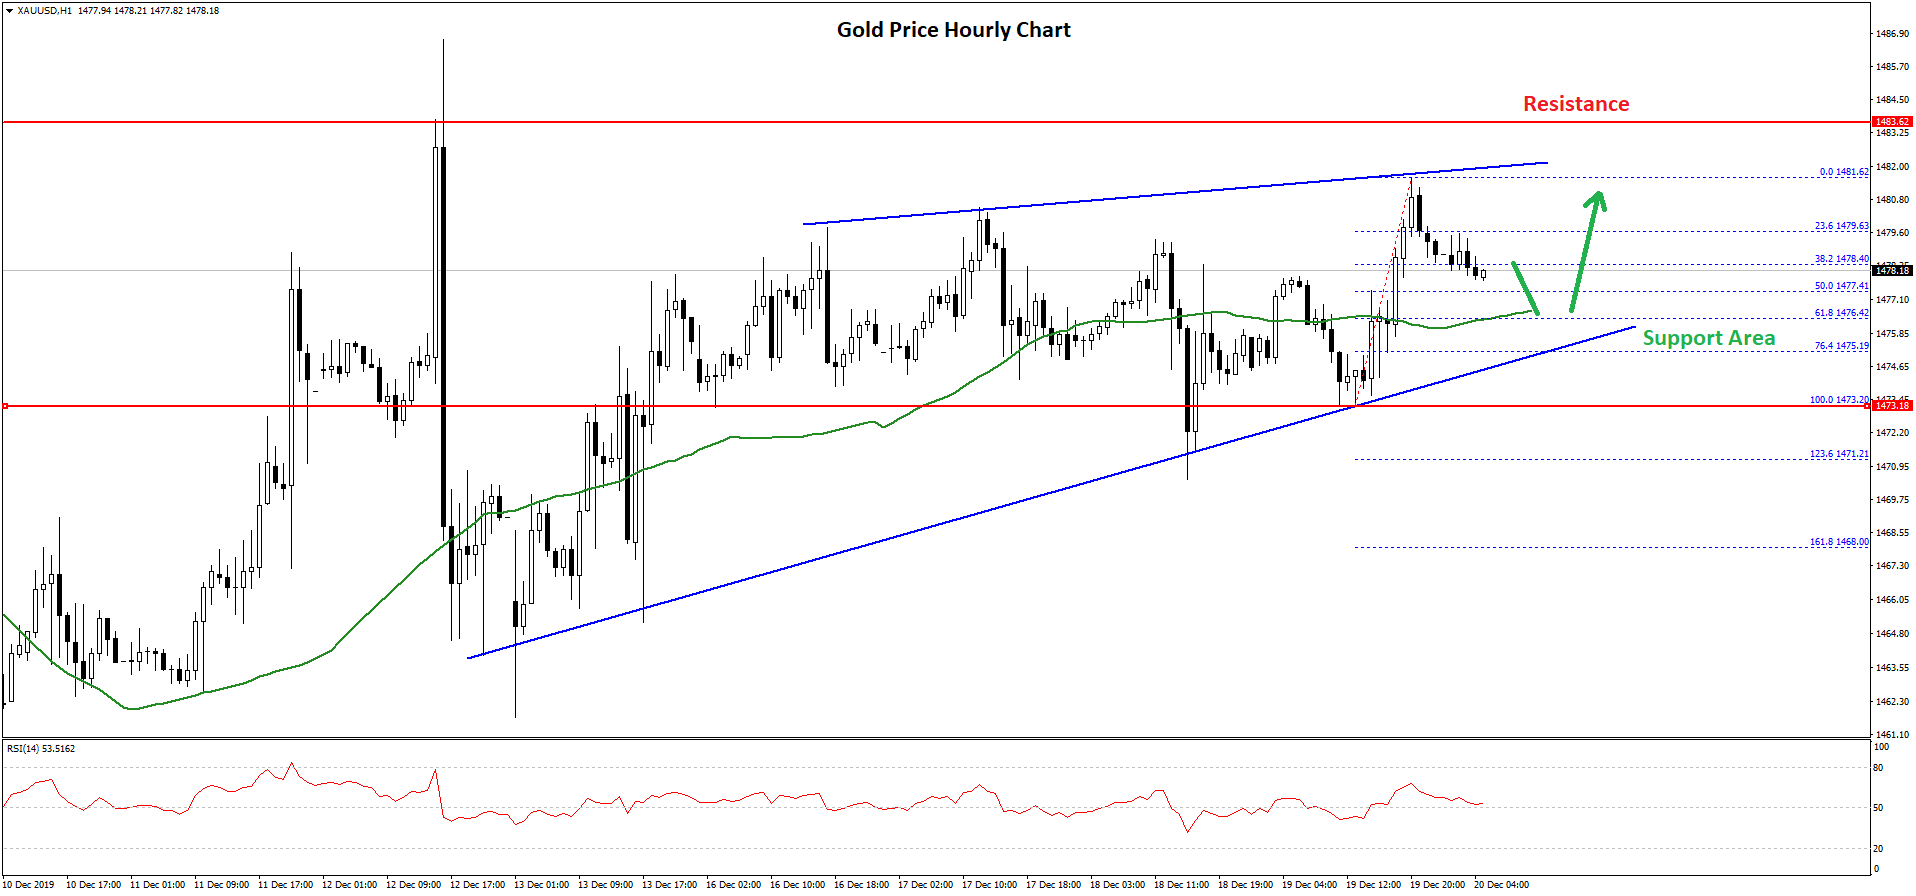
The price is currently correcting lower below $1,480, plus the 23.6% Fib retracement level of the upward move from the $1,473 low to $1,481 high.
An immediate support is near the $1,477 level. Besides, the 50% Fib retracement level of the upward move from the $1,473 low to $1,481 high is near $1,477.
The main support is near the $1,475 level. There is also a major bullish trend line forming with support near $1,475 on the hourly chart of gold. Therefore, a downside break below $1,475 could push the price towards the $1,470 support area.
On the upside, the main hurdles are seen near the $1,480 and $1,482 levels. If there is an upside break above the $1,482 resistance, the price could climb towards the $1,490 area. Any further gains could lead gold price towards the $1,500 resistance area in the near term.
Oil Price Technical Analysis
In the past few days, there was a strong uptrend established in crude oil price above the $58.50 support area against the US Dollar. The price traded above the $59.50 and $60.00 resistance levels.
Moreover, there was a close above the $60.00 level and the 50 hourly simple moving average. It opened the doors for more gains above $61.00 and $61.20. The recent high was near $61.31 and the price is currently correcting lower.
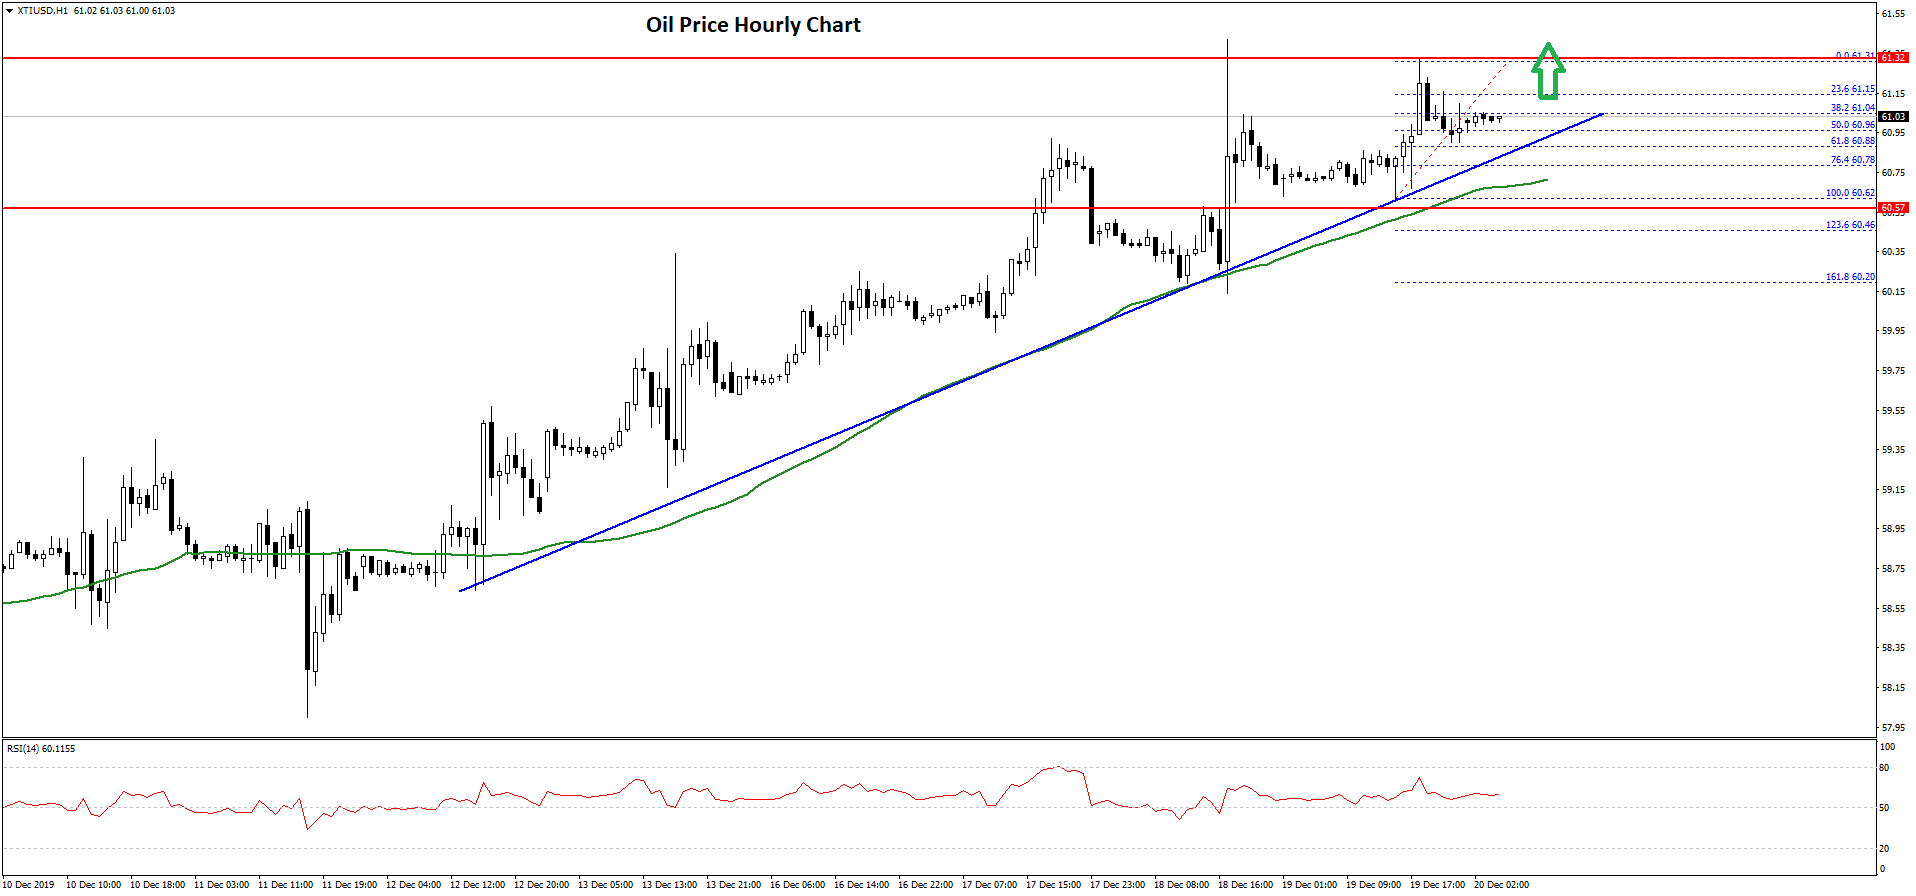
It broke the 50% Fib retracement level of the recent wave from the $60.62 low to $61.31 high. On the downside, there are many supports near $60.95 $60.60.
More importantly, there is a crucial bullish trend line forming with support near $60.90 on the hourly chart of XTI/USD. If there is a break below the trend line, the price could test the $60.75 support or the 50 hourly simple moving average.
The main support zone is near the $60.50 level, below which crude oil price is likely to accelerate lower below the $60.20 and $60.00 levels in the coming sessions.
Conversely, crude oil price could continue to rise above $61.20 and $61.30. The main hurdle is near the $61.50 level, above which the bulls are likely to aim a test of the $62.00 resistance area.
Trade over 50 forex markets 24 hours a day with FXOpen. Take advantage of low commissions, deep liquidity, and spreads from 0.0 pips. Open your FXOpen account now or learn more about trading forex with FXOpen.
This article represents the opinion of the Companies operating under the FXOpen brand only. It is not to be construed as an offer, solicitation, or recommendation with respect to products and services provided by the Companies operating under the FXOpen brand, nor is it to be considered financial advice.
Latest from Forex Analysis
Latest articles

Since the Start of the Week, Brent Oil Price Has Dropped over 4%
At the beginning of the week, March 15, we wrote that the price of Brent oil could form a correction from the resistance level of USD 91 per barrel. Since then, the price has decreased by more than 4% due

Fair Value Gaps vs Liquidity Voids in Trading
Understanding fair value gaps and liquidity voids is essential for traders seeking to navigate the complexities of the financial markets. These concepts, deeply rooted in the Smart Money Concept (SMC), provide valuable insights into the dynamics of supply and demand,
UK100 Share Index Rises as UK Inflation Slows
Yesterday, the UK Office for National Statistics (ONS) reported that the CPI stood at 3.2% in March. According to ForexFactory, analysts expected 3.1%, and a month ago the index was 3.4%.
Grant Fitzner, chief economist at the