


FXOpen
Gold price is placed nicely in a positive zone above the $1,228 support. On the other hand, oil price is under pressure below the $67.50 and $68.50 resistances.
Important Takeaways for Gold and Oil
- Gold price failed to break the $1,240 resistance and declined recently against the US Dollar.
- There is a major bullish trend line formed with support at $1,228 on the hourly chart of gold.
- Crude oil price fell recently and broke the $68.00 and $67.50 support levels.
- There is a new breakout structure forming with resistance near $67.00 on the hourly chart of XTI/USD.
Gold Price Technical Analysis
Gold price gained traction recently and moved up from the $1,221 support area against the US Dollar. The price traded higher and breached the $1,225, $1,230 and $1,236 resistance levels.
During the upside move, the price cleared the $1,238 resistance as well along with the 50 hourly simple moving average. However, buyers failed to clear the $1,240 resistance area. There was a downside reaction and the price declined below the $1,235 support level.
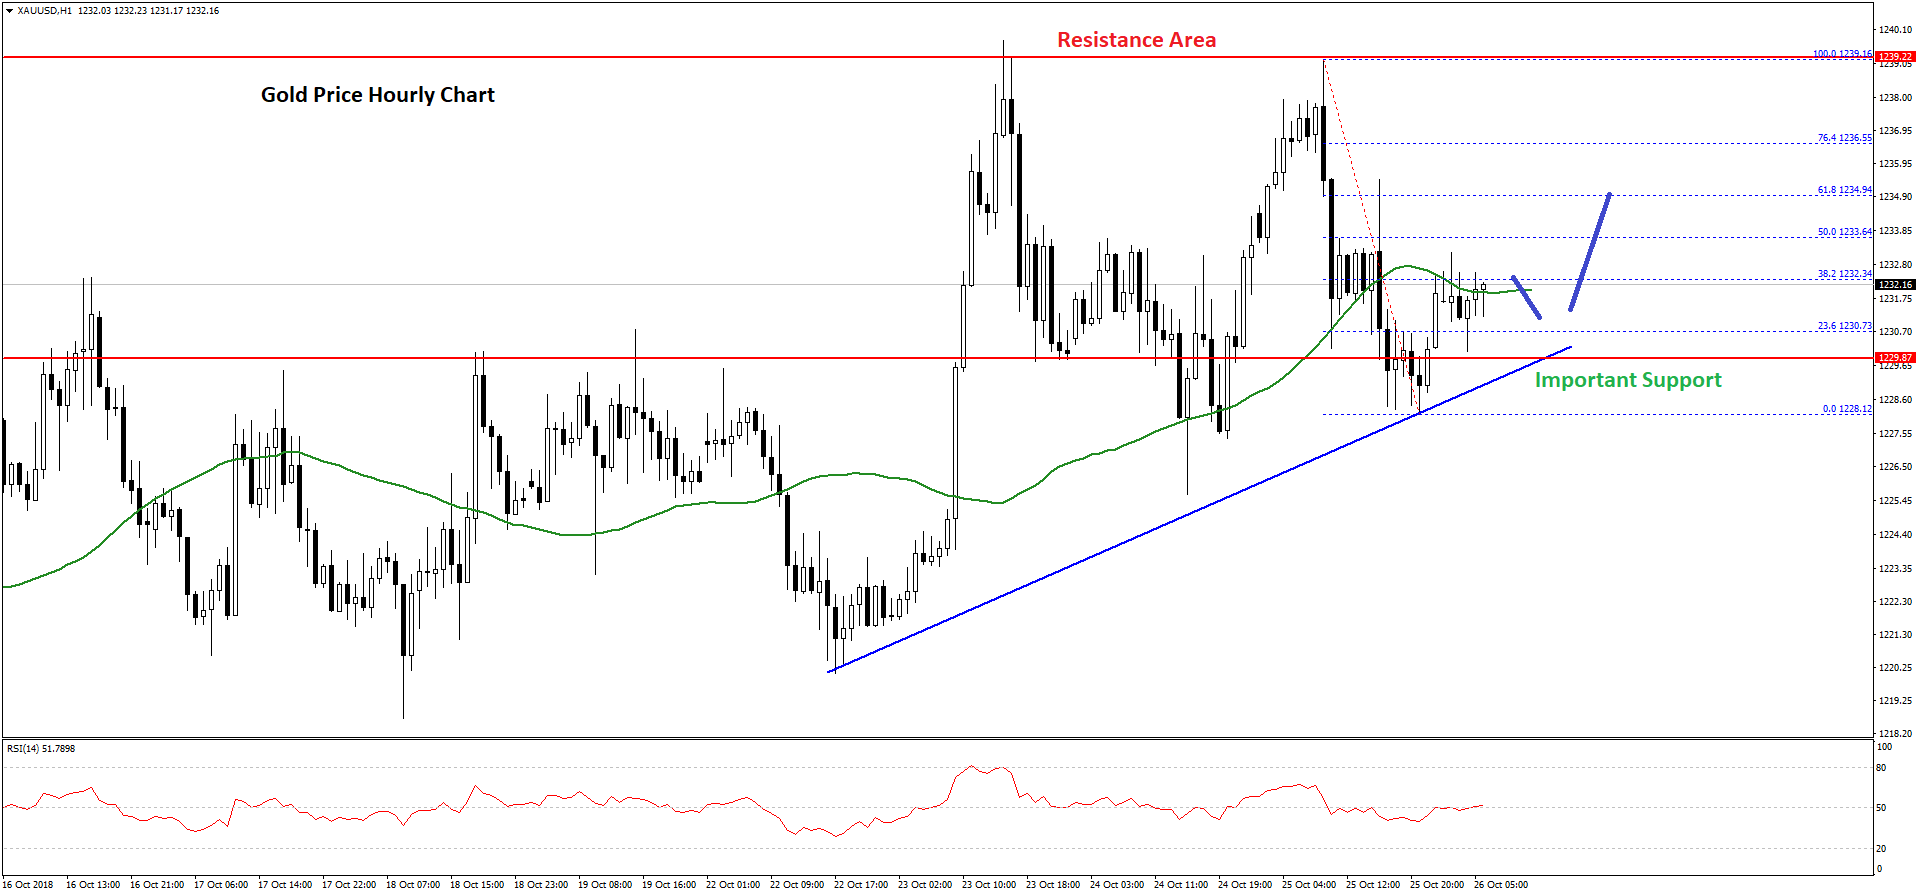
There was also a spike below the $1,230 level and the 50 hourly simple moving average. The price traded as low as $1,228 and later started an upside correction. It moved above the 23.6% Fib retracement level of the last decline from the $1,239 high to $1,228 low.
On the upside, the next resistance is near the $1,233 level, which is the 50% Fib retracement level of the last decline from the $1,239 high to $1,228 low.
A successful close above the $1,233 and $1,235 resistance levels could open the doors for a push towards the $1,240 level in the near term. On the downside, there is a decent support near the $1,229 and $1,228 levels.
Moreover, there is a major bullish trend line formed with support at $1,228 on the hourly chart of gold. If the price fails to stay above the trend line and the $1,228 support, there could be a downside extension towards the $1,222 level.
Oil Price Technical Analysis
Crude oil price started a major downside move from the $72.00 swing high against the US Dollar. The price declined sharply and broke the $71.00, $70.00, $68.50 and $67.00 support levels.
The decline was such that there was a close below the $67.00 level and the 50 hourly simple moving average. The price traded as low as $65.74 and it is currently correcting higher. Buyers pushed the price above the $67.00 level and the 38.2% Fib retracement level of the recent decline from the $69.62 high to $65.74 low.
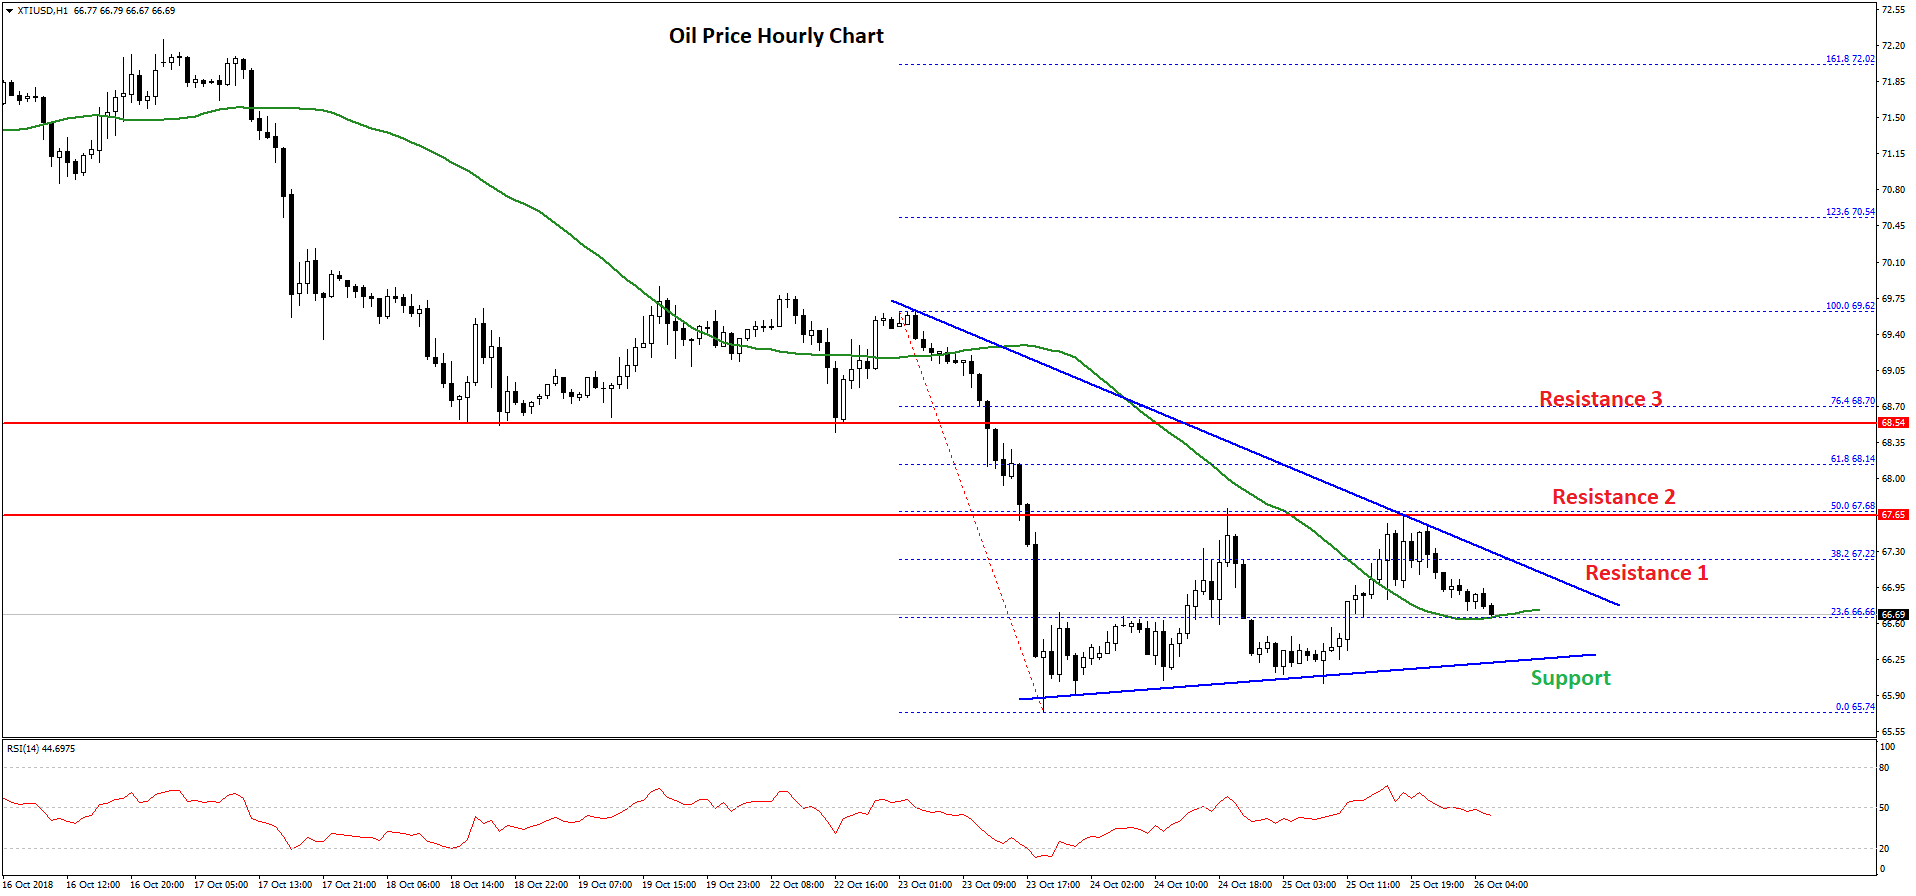
However, the upside move was protected by the $67.70 level and the 50% Fib retracement level of the recent decline from the $69.62 high to $65.74 low.
At the outset, there is a new breakout structure forming with resistance near $67.00 on the hourly chart of XTI/USD. On the upside, the price must break the $67.00 and $67.50 resistance levels to start a decent recovery in the near term.
On the other hand, if there is a downside break below the $66.30 support, the price may extend the current decline towards the $65.74 low. Any further declines could put a lot of pressure on buyers and the price may decline towards the $65.00 and $64.00 supports.
Trade over 50 forex markets 24 hours a day with FXOpen. Take advantage of low commissions, deep liquidity, and spreads from 0.0 pips. Open your FXOpen account now or learn more about trading forex with FXOpen.
This article represents the opinion of the Companies operating under the FXOpen brand only. It is not to be construed as an offer, solicitation, or recommendation with respect to products and services provided by the Companies operating under the FXOpen brand, nor is it to be considered financial advice.
Latest from Forex Analysis
Latest articles

Look East! An Exciting Insight into FXOpen's New Hong Kong-listed Stock CFDs
Hong Kong has built up a gilt-edged reputation as one of the world's most reputable financial market centres. The city of Hong Kong enjoyed a unique position for many years. It is situated in the Asia Pacific region, very close
AUD/USD Rises Sharply on Inflation News
The Consumer Price Index for Australia was released this morning. According to ForexFactory:
→ CPI in quarterly terms: actual = 1.0%, expected = 0.8%, previous value = 0.6%;
→ CPI in annual terms: actual = 3.5%, expected = 3.4%, previous value = 3.

TSLA Share Price Up About 13% Despite Disappointing Report
Yesterday, TSLA trading closed at USD 144.68 per share, after which Tesla reported its results for the 1st quarter:
→ earnings per share: actual = USD 0.45, forecast = USD 0.49;
→ gross income: actual = USD 21.45 billion, forecast = USD