


FXOpen
Gold price is following an uptrend above the $1,200 support. Similarly, dips in crude oil price remains supported near the $69.80 and $69.50 levels.
Important Takeaways for Gold and Oil
- Gold price is trading with a bullish bias above the $1,200 support area against the US Dollar.
- There is a crucial ascending channel forming with support at $1,204 on the hourly chart of gold.
- Crude oil price climbed above the $71.00 level recently and is currently correcting lower.
- There are two bullish trend lines in place with support at $70.00 and $69.20 on the hourly chart of XTI/USD.
Gold Price Technical Analysis
Gold price was rejected on a couple of occasions near the $1,194-1,195 support zone against the US Dollar. The price formed a base and later started an upside move above the $1,200 resistance.
There was a nice upside move and the price even broke the $1,205 resistance and the 50 hourly simple moving average. The price traded towards the $1,210 level and formed a high at $1,210.04.
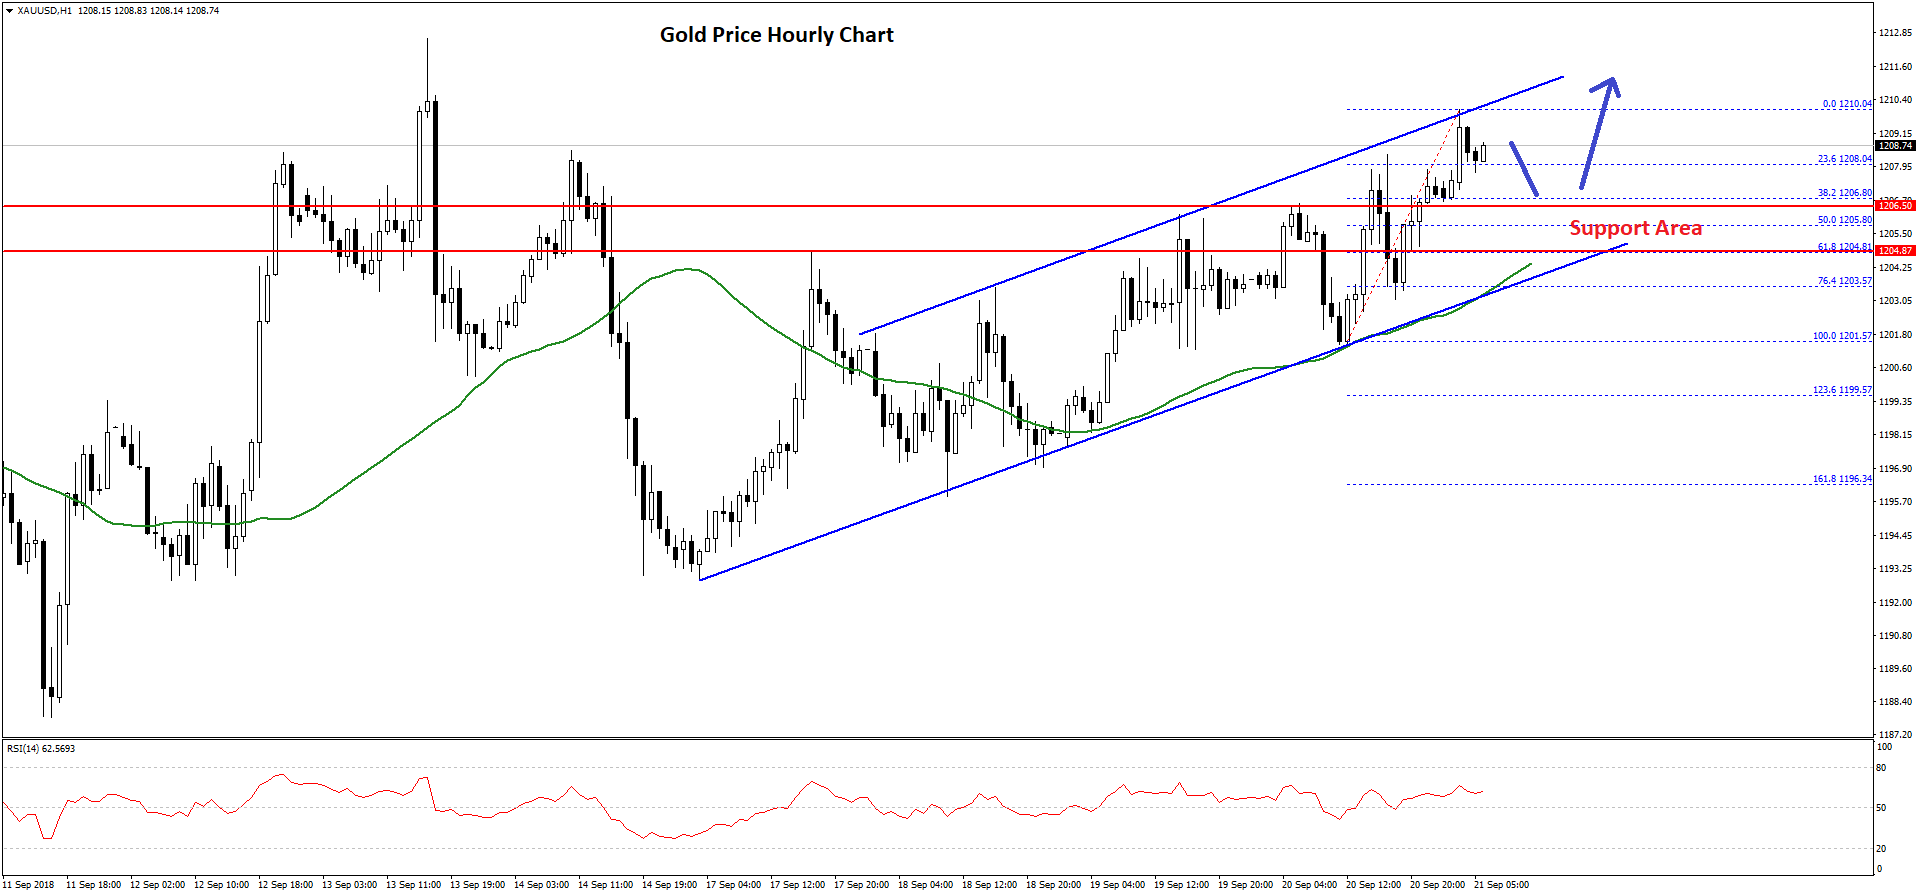
Later, there was a downside correction and the price tested the 23.6% Fib retracement level of the last wave from the $1,201 low to $1,210 high. The current price action is positive and any dips from the current levels towards the $1,205 level remains supported.
There is also a crucial ascending channel forming with support at $1,204 on the hourly chart of gold. Above the channel support, the 50% Fib retracement level of the last wave from the $1,201 low to $1,210 high is at $1,205.
Around the channel support, the 50 hourly SMA is positioned at $1,204.50. Therefore, if the price dips towards $1,204-1,205, it is likely to find a strong buying interest. Should there be a break below the channel support, the price may drop back towards the $1,200 level.
On the other hand, if the price continues to move higher, it may perhaps break the $1,210 hurdle and rise towards the $1,215 level.
Oil Price Technical Analysis
Crude oil price also made a nice upside move above the $70.00 level recently against the US Dollar. The price even broke the $71.00 level, but buyers failed to hold gains above the $71.20 level.
Later, the price started a downside correction and declined below the $71.00 level. Sellers pushed the price below the 50% Fib retracement level of the last wave from the $69.32 low to $71.28 high.
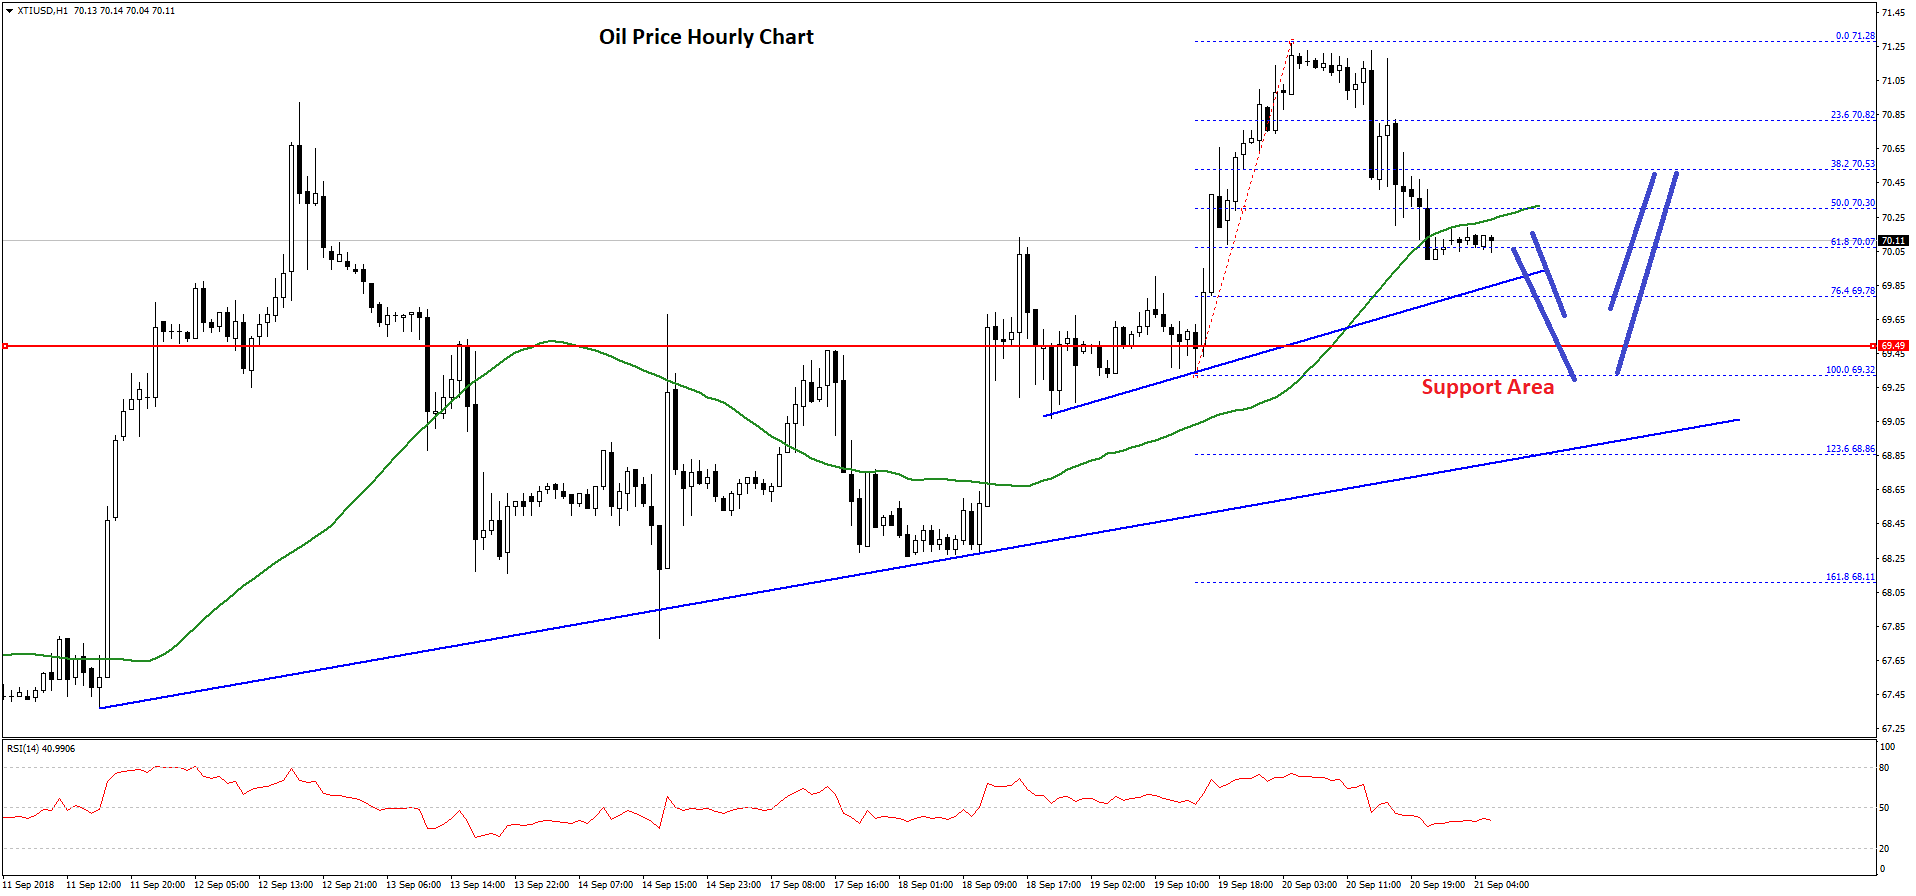
Moreover, there was a close below the $70.50 support and the 50 hourly simple moving average. However, there are many supports on the downside above the $69.50 level. There are also two bullish trend lines in place with support at $70.00 and $69.20 on the hourly chart of XTI/USD.
The first trend line is close to the 76.4% Fib retracement level of the last wave from the $69.32 low to $71.28 high. Below the first trend line, the price could test the $70.00 support. Finally, the most important support is near the $69.30-50 zone.
Once the current correction phase is complete, the price could rise once again above the $70.50 level. Above this, there is a strong resistance zone near the $71.00 and $71.20 levels where buyers are likely to struggle.
Trade over 50 forex markets 24 hours a day with FXOpen. Take advantage of low commissions, deep liquidity, and spreads from 0.0 pips. Open your FXOpen account now or learn more about trading forex with FXOpen.
This article represents the opinion of the Companies operating under the FXOpen brand only. It is not to be construed as an offer, solicitation, or recommendation with respect to products and services provided by the Companies operating under the FXOpen brand, nor is it to be considered financial advice.
Latest from Forex Analysis
Latest articles

Google Share Price Rose Post-market to a New All-time Record
Yesterday, after the close of the main trading session, a report on activities for the 1st quarter of Alphabet Inc. (Google's parent company) was published. The report was strong, exceeding investors' expectations.
→ Quarterly EPS = USD 1.89 (expected = USD 1.

S&P 500 Rebounds after Negative GDP News
Data released yesterday showed US GDP growth slowed to 1.6% in the first quarter of the year. According to ForexFactory: forecast = 2.2%, past value = 2.4%.
Reaction to the news sent the S&P 500 mini stock

GBP/USD And USD/CAD Daily Chart Outlook
GBP/USD is attempting a recovery wave from 1.2300. USD/CAD is consolidating and might aim for a move above the 1.3760 resistance zone.
Important Takeaways for GBP/USD and USD/CAD Analysis Today
· The British Pound started