


FXOpen
GBP/USD remained under pressure and declined below the 1.2950 support. Conversely, EUR/GBP is following a bullish path and it could continue to move higher towards 0.8920-0.8950.
Important Takeaways for GBP/USD and EUR/GBP
- The British Pound started a major downside move from the 1.3100 swing high.
- There is a major bearish trend line in place with resistance at 1.2900 on the hourly chart of GBP/USD.
- EUR/GBP remains supported on dips near the 0.8870 and 0.8850 levels.
- There are two bullish trend lines in place with supports at 0.8870 and 0.8860.
GBP/USD Technical Analysis
The British Pound started a major downside move from well above 1.3080 against the US Dollar. The GBP/USD broke the 1.3000 and 1.2950 support levels to move into a bearish zone.
The recent decline was such that the pair even broke the 1.2840 support area and settled below the 50 hourly simple moving average. It even traded below the 1.2800 level and formed a low at 1.2770.
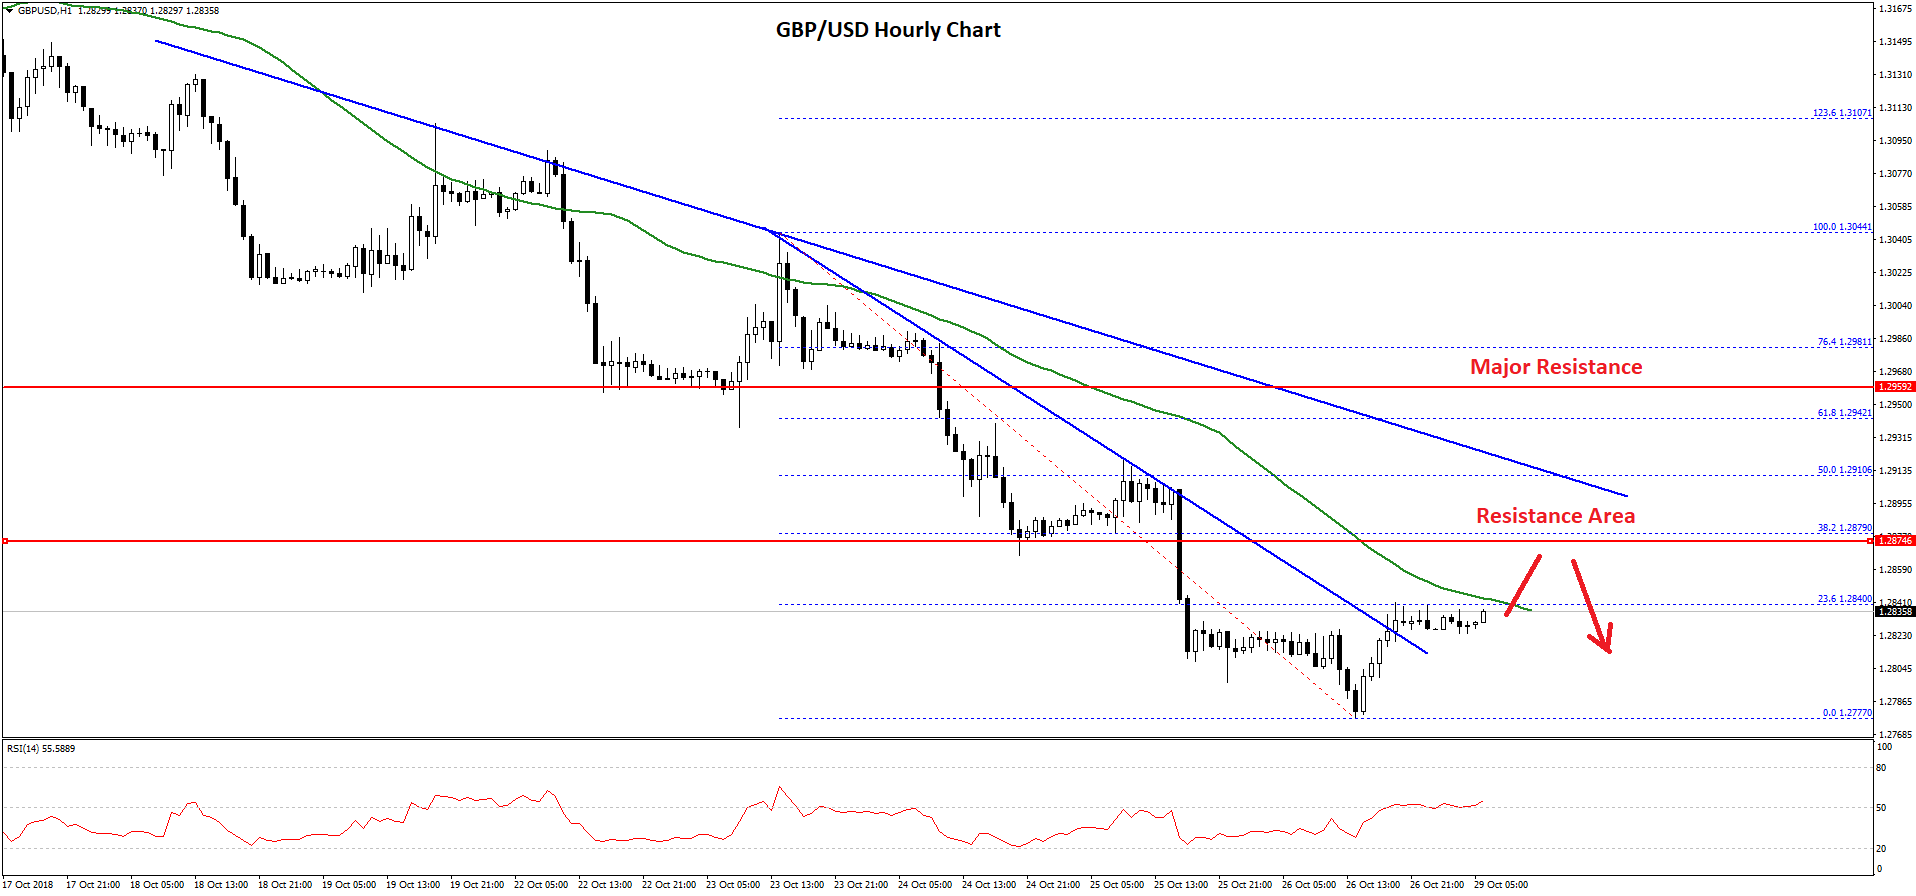
Later, the pair started an upside correction and traded above the 1.2800 level. There was a break above a bearish trend line with resistance at 1.2820 on the hourly chart of GBP/USD. At the moment, the pair is testing the 23.6% Fib retracement level of the last decline from the 1.3044 high to 1.2777 low.
If there is a break above the 1.2845 level and the 50 hourly simple moving average, there could be more gains towards the 1.2880 level, which is a strong resistance.
On the upside, the 38.2% Fib retracement level of the last decline from the 1.3044 high to 1.2777 low near 1.2880 may act as a strong resistance. Moreover, there is a major bearish trend line in place with resistance at 1.2900 on the same chart.
Therefore, if the pair continues to correct higher, sellers are likely to take a stand near the 1.2880 or 1.2900 resistances in the near term.
EUR/GBP Technical Analysis
The Euro started a solid upward move from the 0.8770 swing low against the British Pound. The EUR/GBP pair climbed higher and broke the 0.8800 and 0.8850 resistance levels.
The upward move was strong as there was a close above the 0.8860 level and the 50 hourly simple moving average. The pair recently traded towards the 0.8900 level and formed a high at 0.8896.
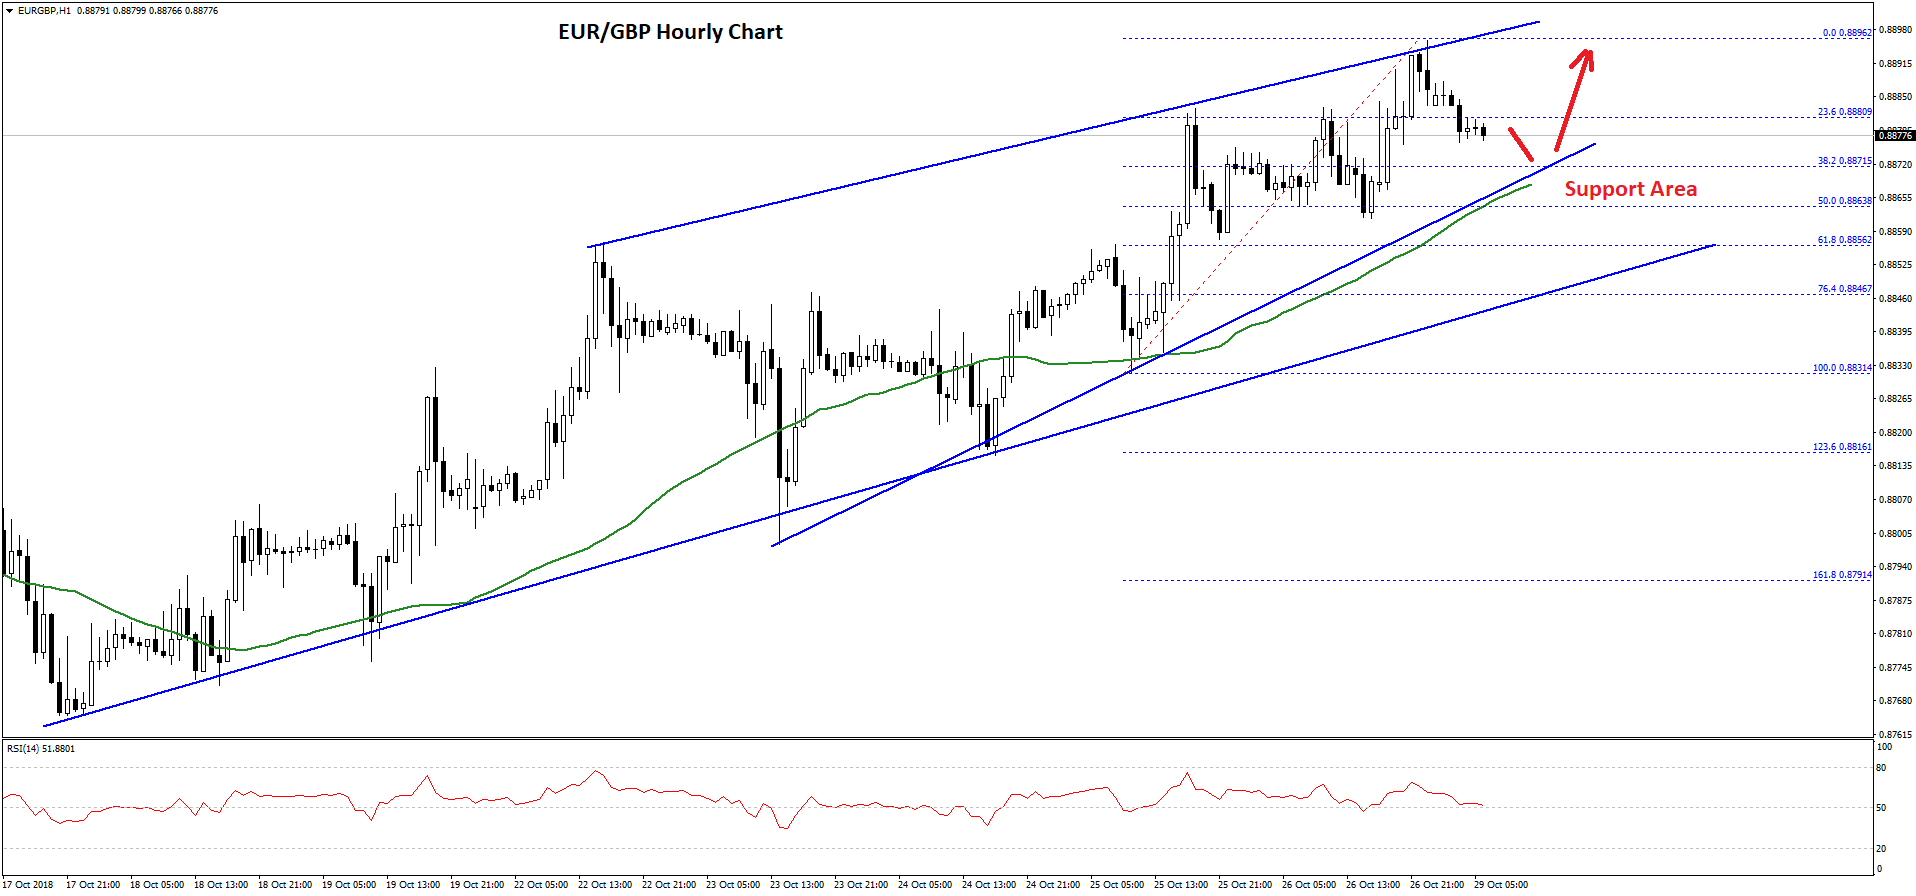
Later, there was a downside correction and the pair declined below the 0.8885 level. It also broke the 23.6% Fib retracement level of the last wave from the 0.8831 low to 0.8896 high. However, there are many important supports on the downside near the 0.8870 level.
There are even two bullish trend lines in place with supports at 0.8870 and 0.8860 on the hourly chart. Between the two trend lines, the 50 hourly SMA and the 50% Fib retracement level of the last wave from the 0.8831 low to 0.8896 high are near 0.8865.
Therefore, if the pair continues to correct lower, it is likely to find a solid buying interest near the 0.8870 and 0.8860 levels. On the upside, EUR/GBP must break the 0.8890 and 0.8900 resistance levels to set the pace for more gains. The next main resistance above 0.8900 is positioned near the 0.8920 level. On the downside, only a break below the 0.8850 level could push the pair back towards the 0.8800 level.
Trade over 50 forex markets 24 hours a day with FXOpen. Take advantage of low commissions, deep liquidity, and spreads from 0.0 pips. Open your FXOpen account now or learn more about trading forex with FXOpen.
This article represents the opinion of the Companies operating under the FXOpen brand only. It is not to be construed as an offer, solicitation, or recommendation with respect to products and services provided by the Companies operating under the FXOpen brand, nor is it to be considered financial advice.
Latest from Forex Analysis
Latest articles

Weekly Market Wrap With Gary Thomson: UK100, USD, GOLD, OIL
Get the latest scoop on the week's hottest headlines, all in one convenient video. Join Gary Thomson, the COO of FXOpen UK, as he breaks down the most significant news reports and shares his expert insights.
- UK100 Share Index Rises

What Is a Darvas Box Theory and How Does It Work in Trading?
The Darvas Box Theory, pioneered by Nicolas Darvas in the 1950s, has transcended its stock market origins to become a valuable tool for forex traders. This method leverages specific price movements and patterns, known as the Darvas Box, to track

NFLX Stock Price Falls Despite Subscriber Growth
Yesterday, after the close of the main trading session on the stock market, Netflix reported to investors for the 1st quarter of 2024.
The report turned out better than expected:
→ earnings per share: actual = USD 5.28, forecast = USD 4.