


FXOpen

GBP/USD is trading above the 1.2920 support, but it is facing many hurdles near 1.3000. GBP/JPY is declining and it remains at a risk of more downsides below 135.00.
Important Takeaways for GBP/USD and GBP/JPY
- The British Pound seems to be consolidating below the key 1.3000 resistance.
- There is a major bullish trend line forming with support near 1.2925 on the hourly chart of GBP/USD.
- GBP/JPY is facing an increase in selling pressure below 136.00 and 135.80.
- There is a key bearish trend line forming with resistance near 135.55 on the hourly chart.
GBP/USD Technical Analysis
This past week, the British Pound found support near the 1.2800 zone against the US Dollar. GBP/USD started a decent increase and surpassed the 1.2880 and 1.2900 resistance levels.
The pair even climbed above the 1.2950 resistance and the 50 hourly simple moving average. However, the pair failed to gain pace above the key 1.3000 resistance zone. The bulls many attempts to clear 1.3000, but they failed.
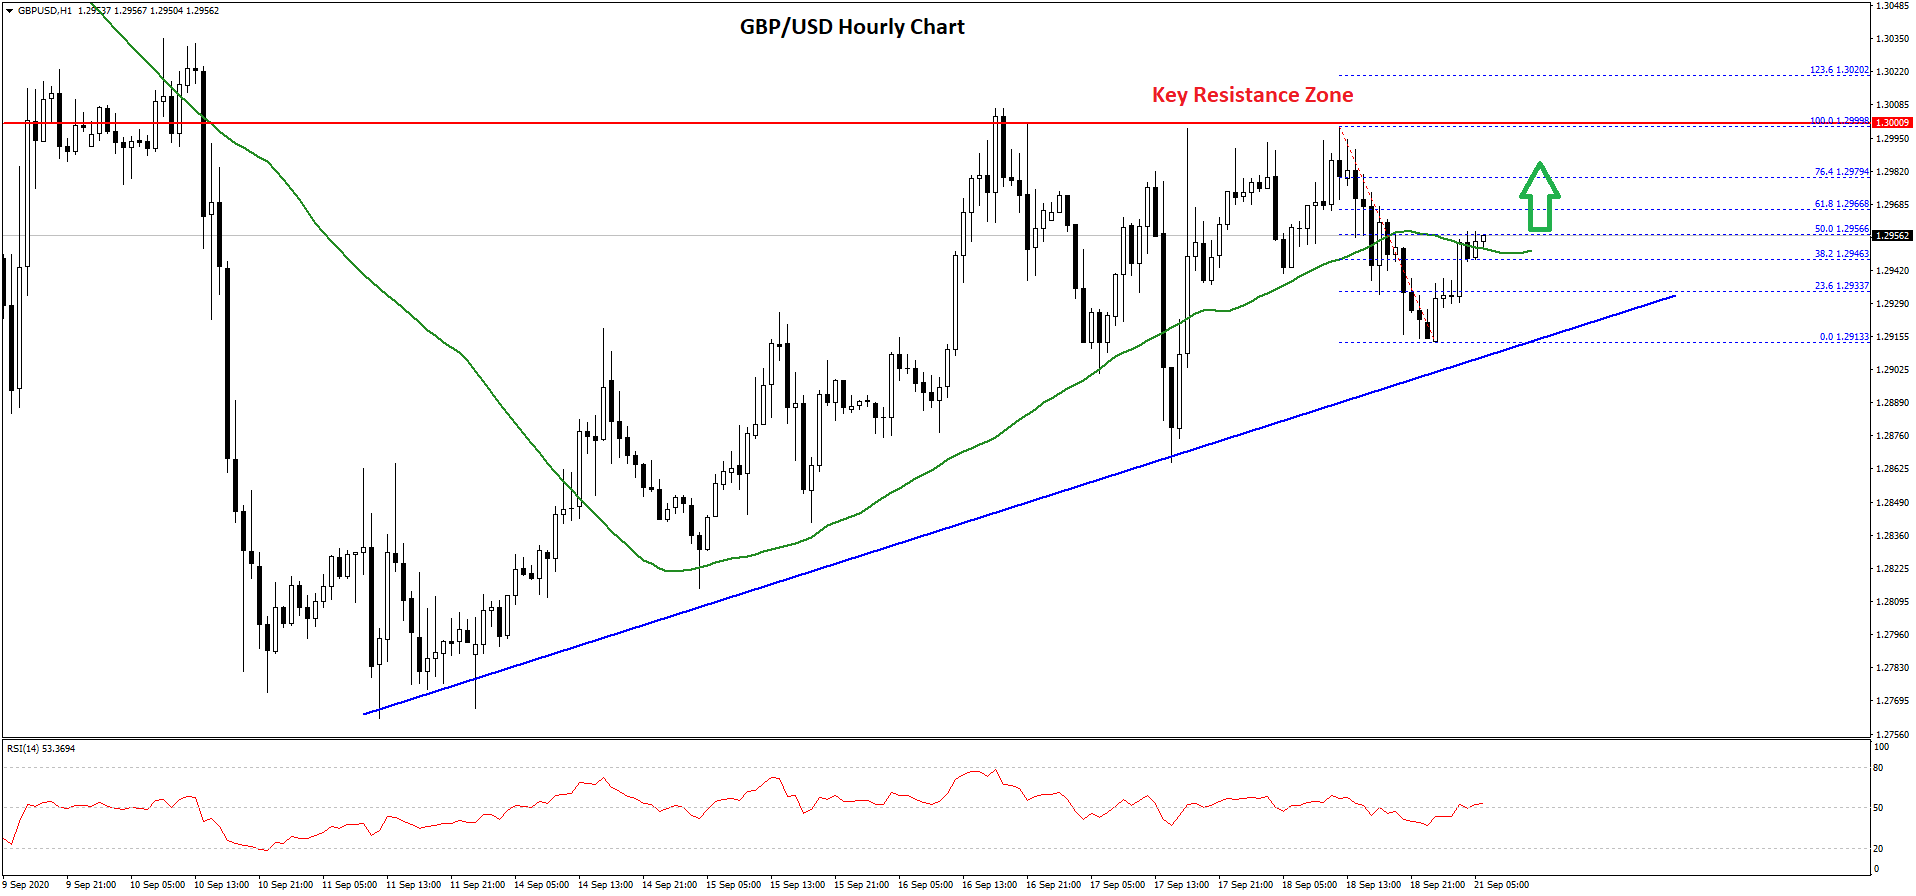
The recent high was formed near 1.2999 on FXOpen before the pair declined back to 1.2910. A low is formed near 1.2913 and the pair is currently correcting higher.
It broke the 1.2940 and 1.2950 resistance levels. There was a break above the 50% Fib retracement level of the recent decline from the 1.2999 high to 1.2913 low. An immediate resistance on the upside is near the 1.2980 level.
The 76.4% Fib retracement level of the recent decline from the 1.2999 high to 1.2913 low is also near the 1.2980 level. The main resistance is still near the 1.3000 handle. A successful close above the 1.3000 resistance is needed for a further gains.
On the downside, there is a major bullish trend line forming with support near 1.2925 on the hourly chart of GBP/USD. A clear break below the trend line support might start another decline and the pair could decline towards the 1.2800 support.
GBP/JPY Technical Analysis
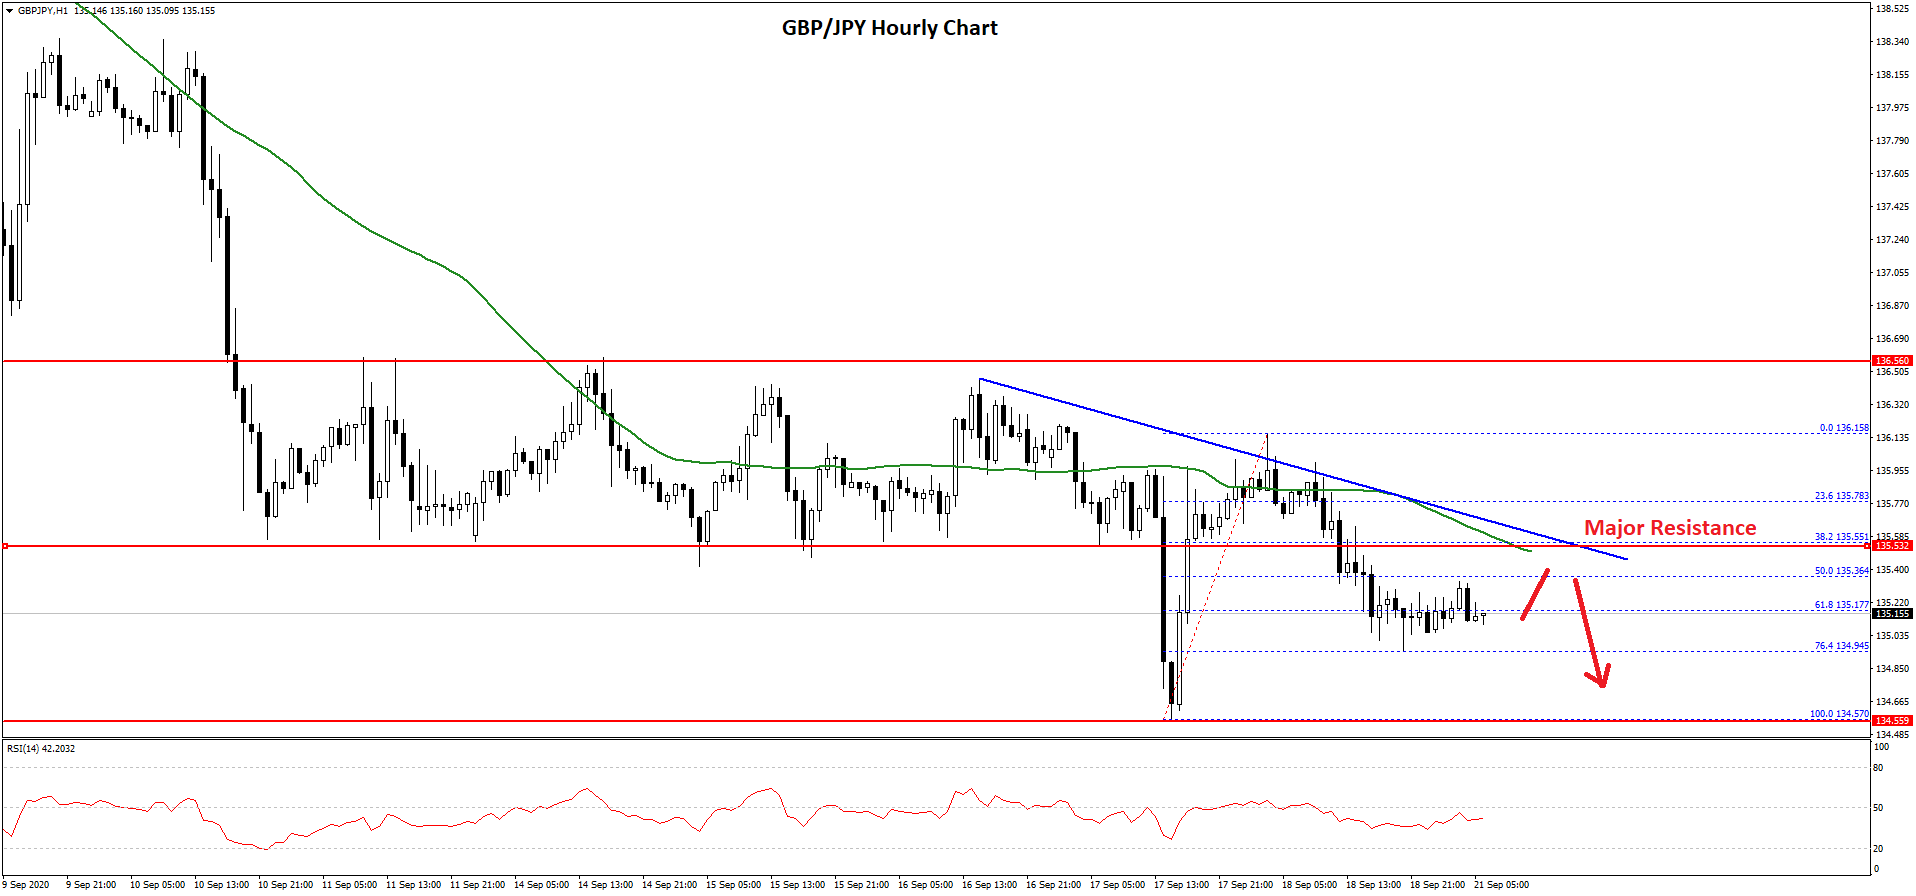
The British Pound remained in a bearish zone below the 138.00 level against the Japanese Yen. The GBP/JPY pair broke the 137.00 support to move into a short-term bearish zone.
There was also a break below the 135.80 support and the pair settled below the 50 hourly simple moving average. The pair traded towards the 134.50 support zone and a low is formed near 134.57.
 gbp
gbp
Recently, the pair corrected higher and broke the 136.00 level. However, the upward move was capped by the 136.15 zone and the 50 hourly simple moving average. The pair is currently declining and trading below 136.00.
It traded below the 50% Fib retracement level of the recent wave from the 134.57 low to 136.15 high. There is also a key bearish trend line forming with resistance near 135.55 on the hourly chart.
An initial support is near the 135.00 and 134.95 levels. The 76.4% Fib retracement level of the recent wave from the 134.57 low to 136.15 high is also near 134.95. A close below the 135.00 level might call for more losses.
The next major support is near the 134.50 level, below which the pair might accelerate lower towards the 134.00 level. If there is an upside break above the trend line resistance and the 50 hourly SMA, the pair could recover towards the 136.50 resistance.
Trade over 50 forex markets 24 hours a day with FXOpen. Take advantage of low commissions, deep liquidity, and spreads from 0.0 pips. Open your FXOpen account now or learn more about trading forex with FXOpen.
This article represents the opinion of the Companies operating under the FXOpen brand only. It is not to be construed as an offer, solicitation, or recommendation with respect to products and services provided by the Companies operating under the FXOpen brand, nor is it to be considered financial advice.
Latest from Forex Analysis
Latest articles

Google Share Price Rose Post-market to a New All-time Record
Yesterday, after the close of the main trading session, a report on activities for the 1st quarter of Alphabet Inc. (Google's parent company) was published. The report was strong, exceeding investors' expectations.
→ Quarterly EPS = USD 1.89 (expected = USD 1.

S&P 500 Rebounds after Negative GDP News
Data released yesterday showed US GDP growth slowed to 1.6% in the first quarter of the year. According to ForexFactory: forecast = 2.2%, past value = 2.4%.
Reaction to the news sent the S&P 500 mini stock

GBP/USD And USD/CAD Daily Chart Outlook
GBP/USD is attempting a recovery wave from 1.2300. USD/CAD is consolidating and might aim for a move above the 1.3760 resistance zone.
Important Takeaways for GBP/USD and USD/CAD Analysis Today
· The British Pound started