


FXOpen
GBP/USD found support near 1.2900 and it is currently recovering above 1.3000. Conversely, USD/CAD is diving and it could continue to slide below 1.3060.
Important Takeaways for GBP/USD and USD/CAD
- The British Pound found support near the 1.2900 area after a strong decline.
- There was a break above a major bearish trend line with resistance near 1.2980 on the hourly chart of GBP/USD.
- USD/CAD is declining and it is now trading well below the 1.3100 support area.
- There was a break below a key bullish trend line with support near 1.3155 on the hourly chart.
GBP/USD Technical Analysis
This past week, the British Pound declined heavily from well above the 1.3200 level against the US Dollar. The GBP/USD pair even broke the 1.3000 support area to trim most its gains.
Finally, the pair found support near the 1.2900 area and recently started an upside correction. A low was formed near 1.2905 on FXOpen and there was a break above a major bearish trend line with resistance near 1.2980 on the hourly chart of GBP/USD.
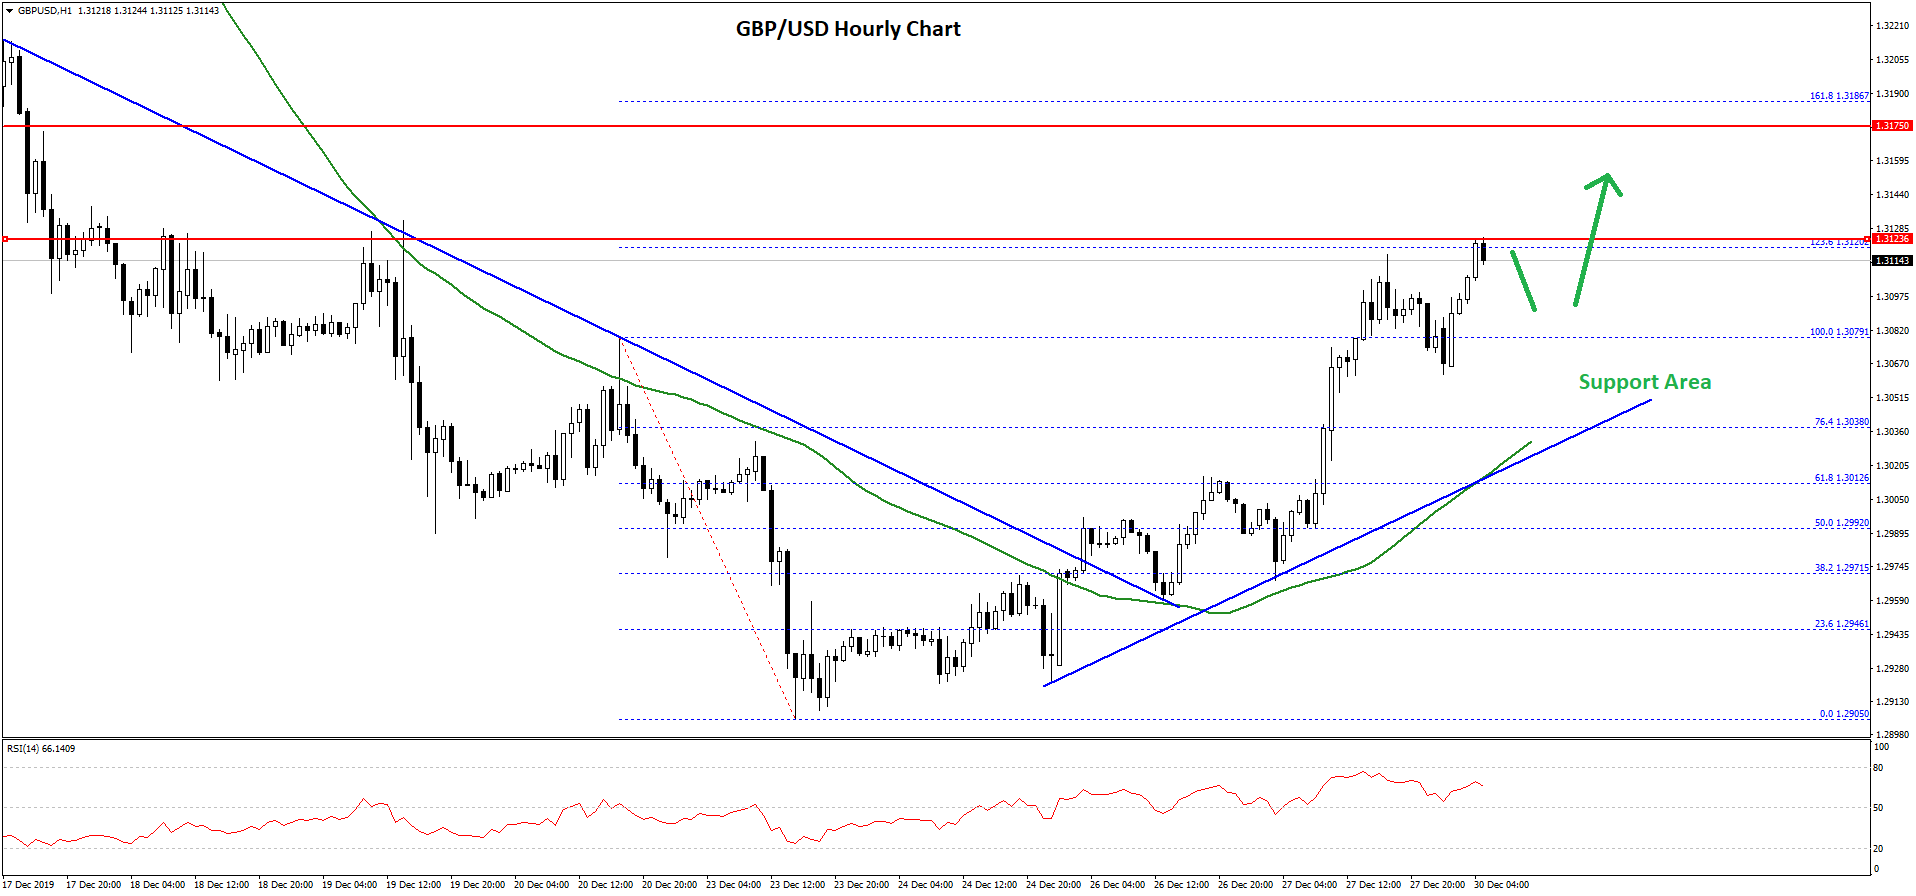
The pair climbed above the 1.3000 resistance and the 50 hourly simple moving average. It opened the doors for more gains above the 1.3050 level.
The pair even climbed above the previous swing high near the 1.3080 level. It is now trading near the 1.236 Fib extension level of the last major decline from the 1.3079 high to 1.2905 low.
It seems like the pair is struggling to clear the 1.3110-1.3120 resistance area. If there is a clear break above 1.3120, GBP/USD could rise further.
The next resistance could be 1.3185 or the 1.618 Fib extension level of the last major decline from the 1.3079 high to 1.2905 low. Conversely, if there is a downward move, the pair could test the 1.3040 and 1.3030 support levels.
Besides, the 50 hourly simple moving average is also near the 1.3030 area to provide support along with a bullish trend line on the same chart. If the pair settles below 1.3000, it could start another decline towards 1.2900.
USD/CAD Technical Analysis
The US Dollar struggled a lot to clear the 1.3180 and 1.3200 resistance levels against the Canadian Dollar. As a result, the USD/CAD pair started a strong decline below the 1.3120 support area.
The pair broke the 1.3100 support area and the 50 hourly simple moving average and 1.3160. Moreover, there was a break below a key bullish trend line with support near 1.3155 on the hourly chart.
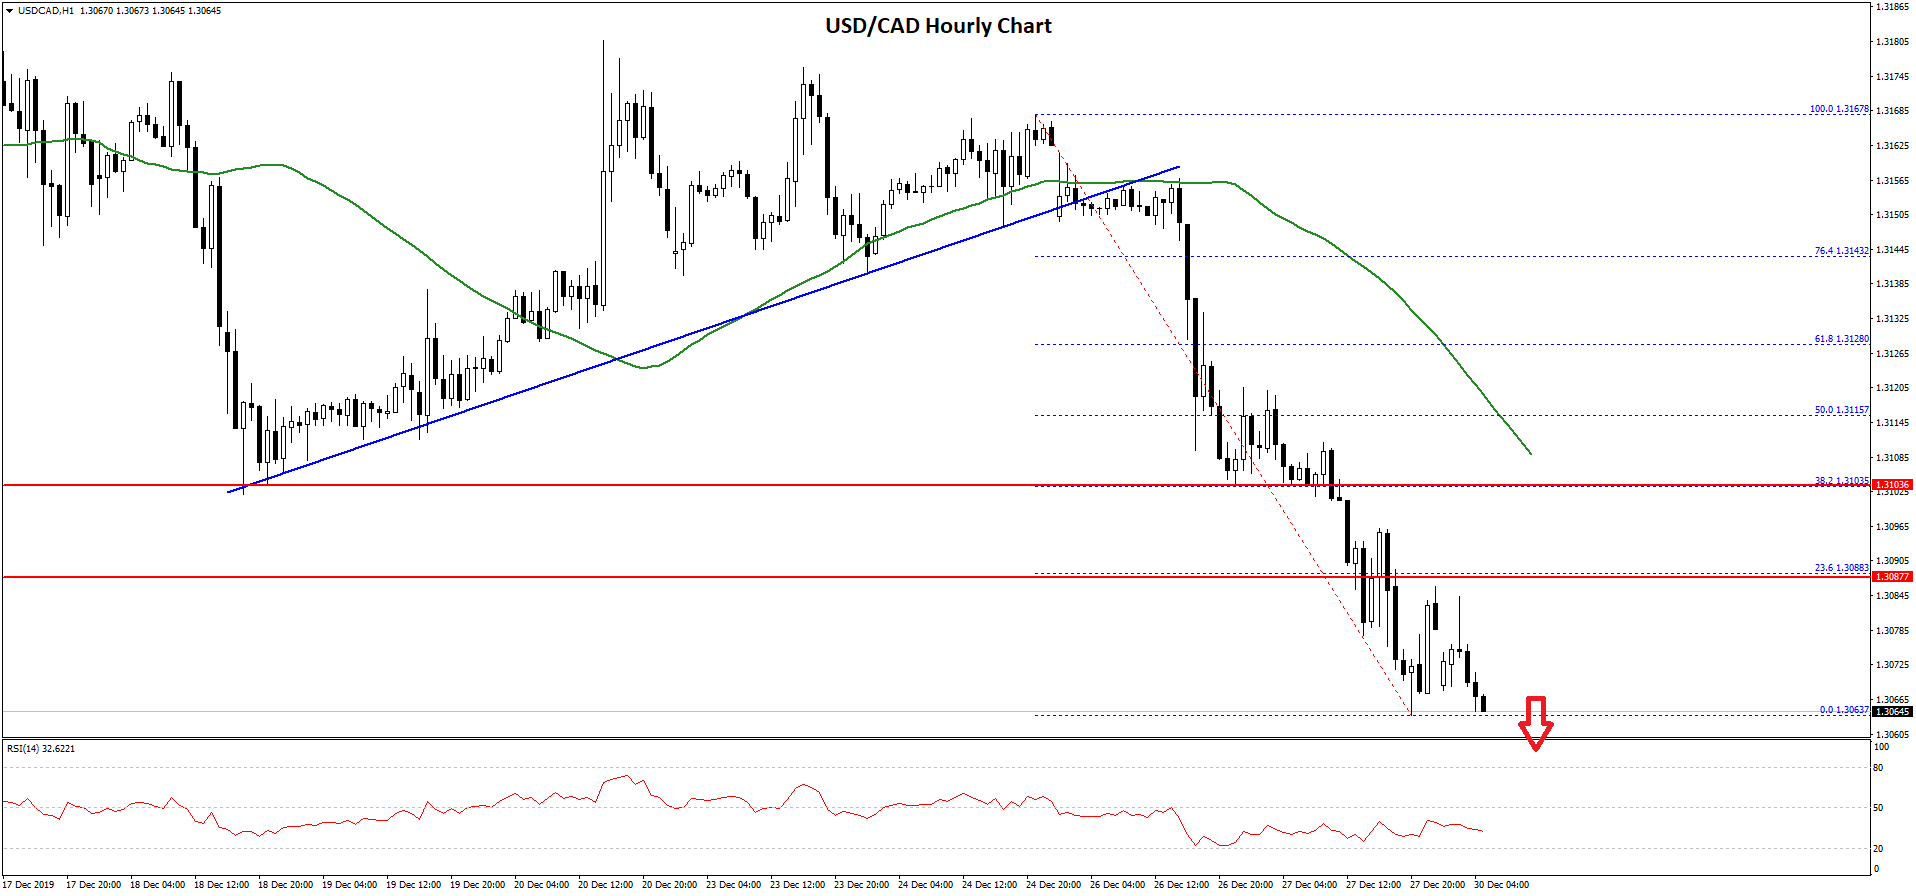
The pair declined below 1.3080 and the recent low was formed near 1.3063. On the upside, an initial resistance is near the 1.3088 level. It is near the 23.6% Fib retracement level of the latest decline from the 1.3167 high to 1.3067 low.
The main resistance is near the 1.3100 area (the recent breakdown zone). It is also near the 38.2% Fib retracement level of the latest decline from the 1.3167 high to 1.3067 low.
On the downside, the pair might find bids near the 1.3060 and 1.3050 levels. If USD/CAD fails to stay above 1.3050, there could be another slide.
The next major support is near the 1.3020 and 1.3000 levels. Any further losses may perhaps lead the pair towards the 1.2960 support area in the near term.
Trade over 50 forex markets 24 hours a day with FXOpen. Take advantage of low commissions, deep liquidity, and spreads from 0.0 pips. Open your FXOpen account now or learn more about trading forex with FXOpen.
This article represents the opinion of the Companies operating under the FXOpen brand only. It is not to be construed as an offer, solicitation, or recommendation with respect to products and services provided by the Companies operating under the FXOpen brand, nor is it to be considered financial advice.
Latest from Forex Analysis
Latest articles

The Price of Gold XAU/USD Shows Strongest Fall in Almost 2 Years
On Monday, the price of gold fell from USD 2,386 to USD 2,333 per ounce — this is the strongest drop in one day in almost 2 years, according to Bloomberg. On Tuesday morning in the Asian session, the

Hong Kong-listed Chinese Insurer Goes on Rally as Western Giants Retract
The Asia Pacific region has once again become an area of great interest to investors and traders as some remarkable patterns of volatility have begun to make their presence felt.
This morning, a few examples of Hong Kong-listed Chinese companies

Bitcoin Price Bullish after Halving-2024
On April 19, 2024, a halving occurred in the Bitcoin network, resulting in the reward for the mined block amounting to 3.125 BTC.
Historically, after the halving (which is associated with a reduction in supply), the price of Bitcoin