


FXOpen

GBP/USD started a fresh decline from well above the 1.3150 pivot level and declined below 1.3000. USD/CAD is showing positive signs and likely to rally above 1.3350.
Important Takeaways for GBP/USD and USD/CAD
- The British Pound started a fresh decline below the 1.3050 and 1.3000 support levels.
- There is a major bearish trend line forming with resistance near 1.2985 on the hourly chart of GBP/USD.
- USD/CAD gained bullish momentum and climbed above the 1.3280 resistance.
- There was a break above a connecting bearish trend line with resistance near 1.3335 on the hourly chart.
GBP/USD Technical Analysis
This past week, the British Pound started a fresh decline from well above the 1.3180 zone against the US Dollar. The GBP/USD pair broke the 1.3120 and 1.3050 support levels to move into a bearish zone.
The pair even broke the 1.3000 support and settled below the 50 hourly simple moving average. Finally, there was a spike below the 1.2900 support and a low was formed near the 1.2880 level.
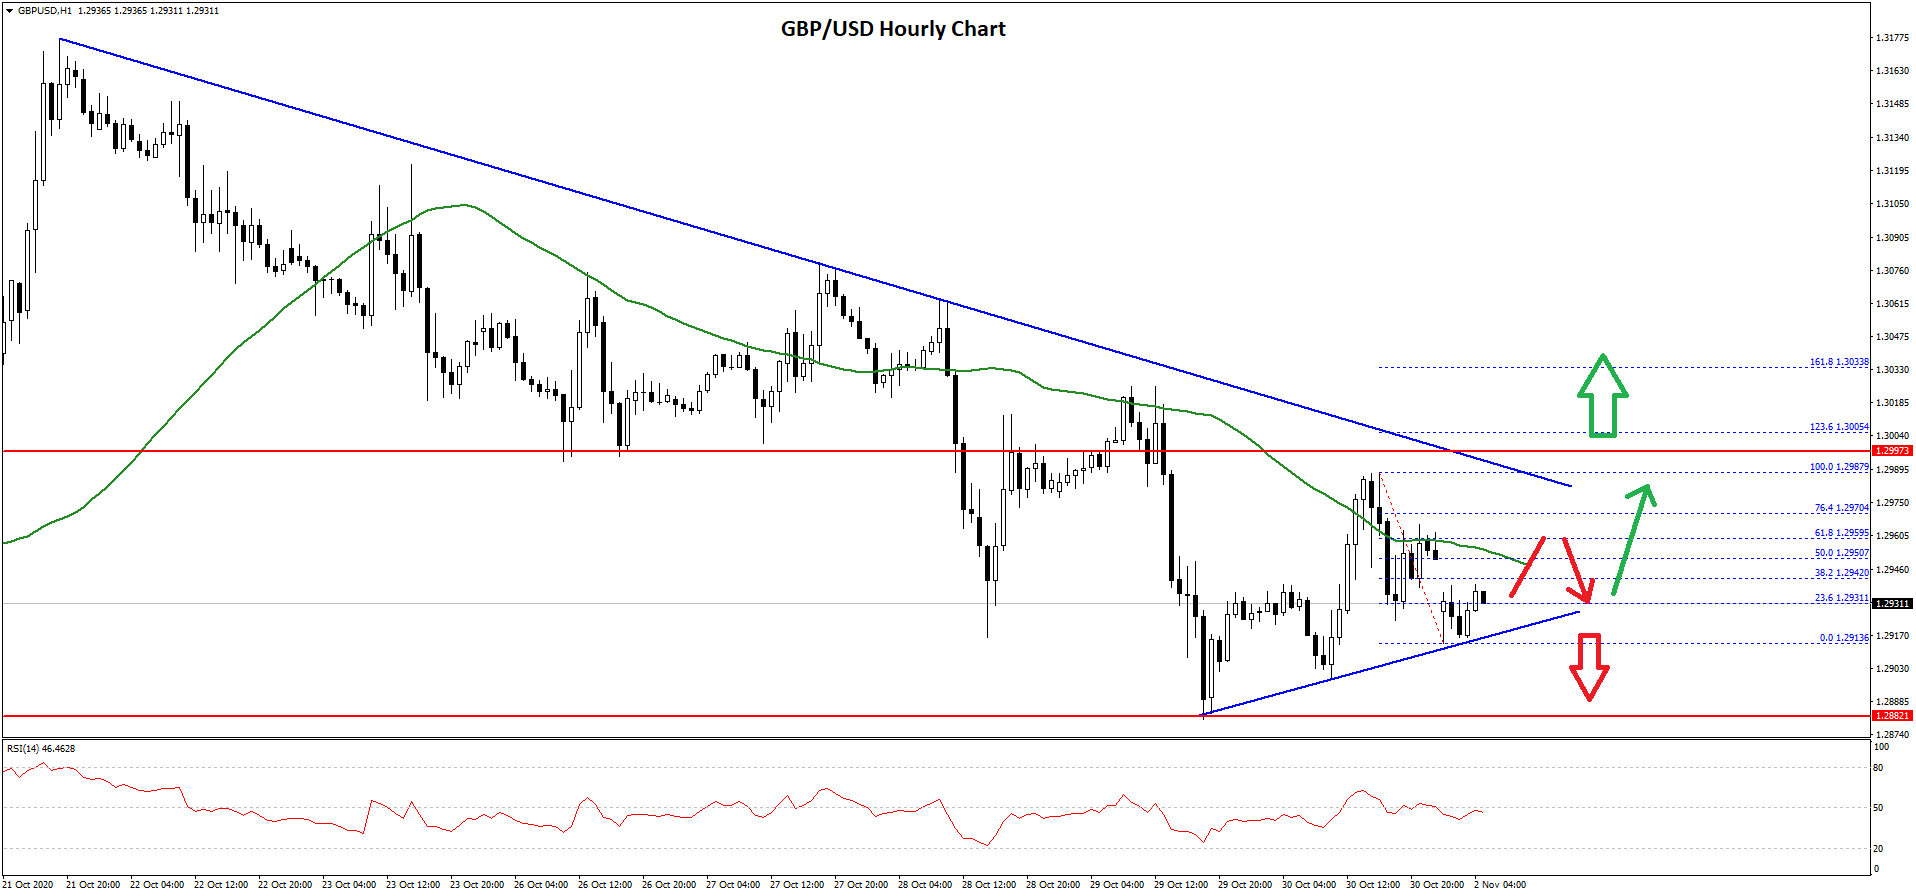
Recently, there was a minor upside correction above the 1.2950 level, but the pair struggled to clear the 1.2985 level. A high was formed near 1.2987 before the pair declined back below 1.2950. It traded as low as 1.2913 and it is currently consolidating losses.
An initial resistance is near the 1.2950 level. It is close to the 50% Fib retracement level of the recent decline from the 1.2987 high to 1.2913 low. The 50 hourly simple moving average is also close to the 1.2950 zone to act as a hurdle.
Moreover, there is a major bearish trend line forming with resistance near 1.2985 on the hourly chart of GBP/USD. To move into a positive zone, the pair must break the 1.2950 and 1.2985 resistance levels in the coming sessions.
If there is a downside break below the trend line support and 1.2915, there could be an extended decline. The next support is near the 1.2900 level, below which the pair is likely to break 1.2880 and decline towards the 1.2840 level.
USD/CAD Technical Analysis
The US Dollar started a major upward move after forming a support base above 1.3120 against the Canadian Dollar. The USD/CAD pair surged above the 1.3200 and 1.3250 resistance levels to move into a positive zone.
The pair even settled above the 1.3280 level and the 50 hourly simple moving average. A high is formed near 1.3385 before the pair corrected lower.
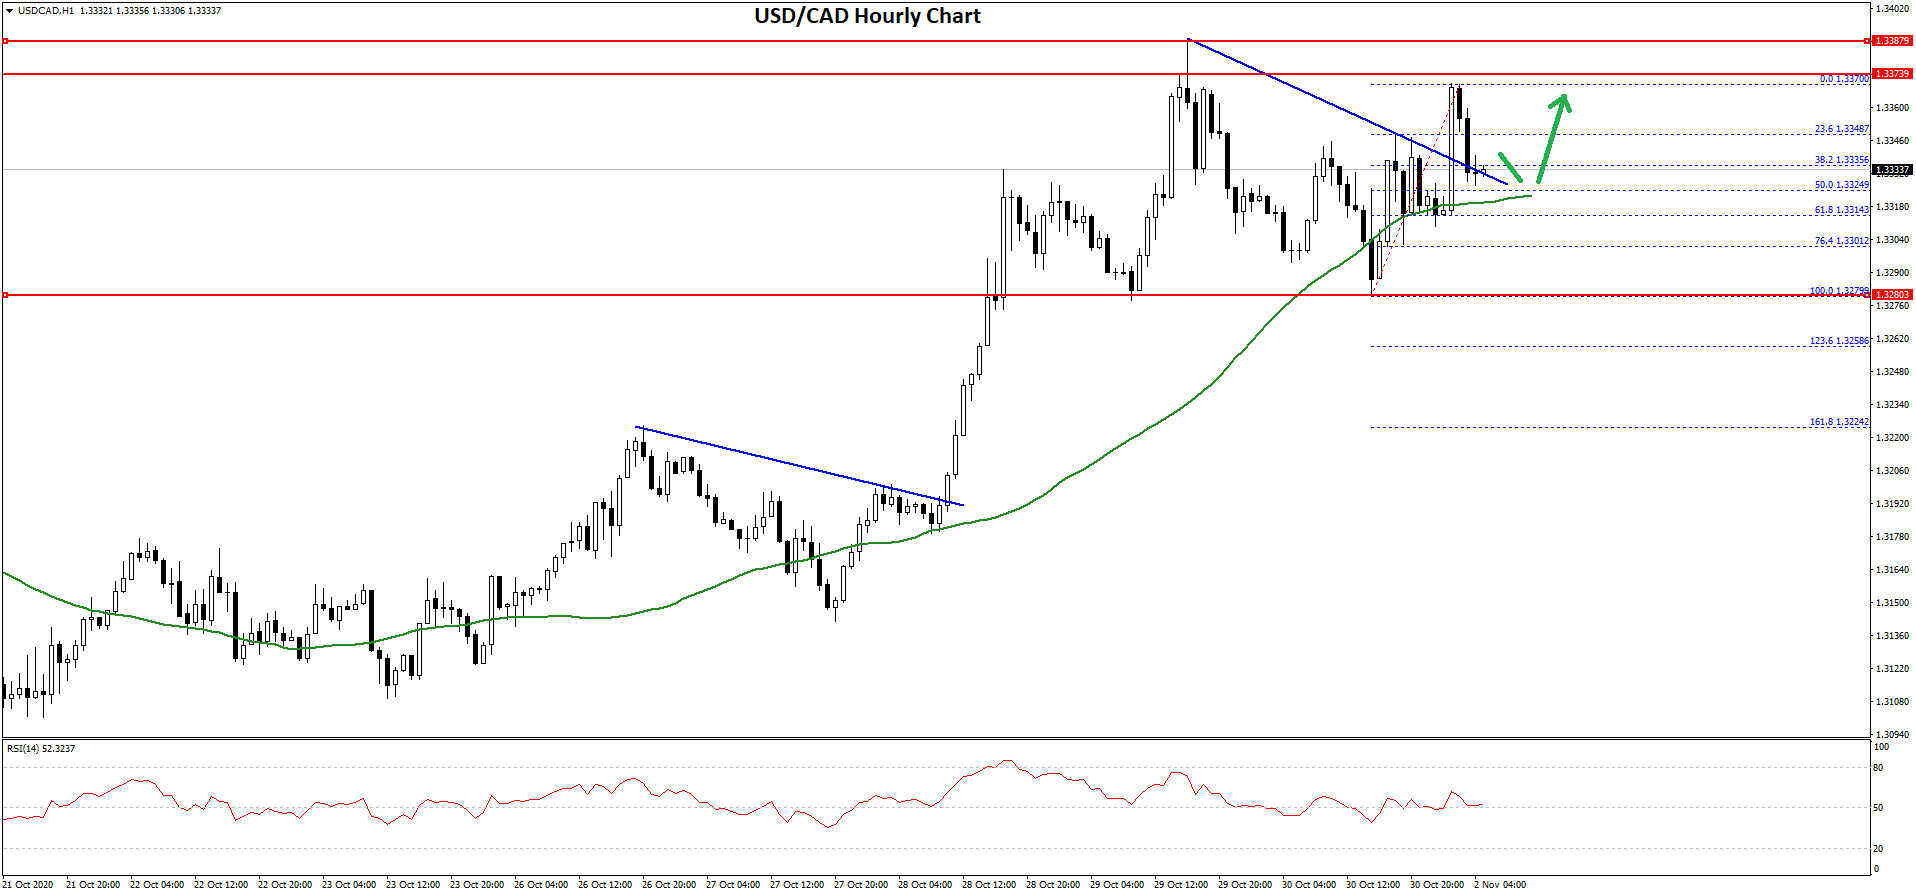
On the downside, the 1.3300 and 1.3280 levels are acting as strong supports. Recently, there was a break above a connecting bearish trend line with resistance near 1.3335 on the hourly chart. The pair is currently consolidating gains near the broken trend line at 1.3340.
The next support is near the 1.3325 or the 50% Fib retracement level of the upward move from the 1.3279 low to 1.3370 high.
The main support is near the 1.3320 or the 50 hourly simple moving average, below which the pair could test the 76.4% Fib retracement level of the upward move from the 1.3279 low to 1.3370 high.
On the upside, the pair is facing hurdles near 1.3360 and 1.3380. A clear break above the 1.3380 resistance could open the doors for a larger increase. The next major hurdle on the upside is near 1.3400, followed by 1.3440.
Trade over 50 forex markets 24 hours a day with FXOpen. Take advantage of low commissions, deep liquidity, and spreads from 0.0 pips. Open your FXOpen account now or learn more about trading forex with FXOpen.
This article represents the opinion of the Companies operating under the FXOpen brand only. It is not to be construed as an offer, solicitation, or recommendation with respect to products and services provided by the Companies operating under the FXOpen brand, nor is it to be considered financial advice.
Latest from Forex Analysis
Latest articles

XAU/USD Gold Price Reaches an Important Resistance Zone
The XAU/USD gold chart today indicates that the historical record price of the metal is above USD 2,400 per ounce.
In addition to fears of a new round of inflation due to rising commodity prices, geopolitical tensions are

What Is a Break of Structure and How Can You Trade It?
In the ever-evolving world of Smart Money Concept (SMC) trading, a nuanced understanding of market dynamics is indispensable. This article explores the concept of Break of Structure (BOS), how to identify it, and its implications for trading strategies, setting traders

Hong Kong Stocks Become Top Risers After Wild Ride Subsides
Hong Kong enjoyed a sterling reputation for an entire century as a highly polished, utterly stable mantlepiece upon which global corporations could comfortably sit and where an international talent base could reside in fabulous surroundings and approach European, American, African