


GBP/USD Continues To Struggle, USD/CAD Gains Momentum
FXOpen
GBP/USD failed to recover and declined below the 1.3250 support. USD/CAD is rising and is showing positive signs above the 1.2850 support.
Important Takeaways for GBP/USD and USD/CAD
· The British Pound started a fresh decline from the 1.3375 resistance zone.
· There was a break below a key bullish trend line with support near 1.3235 on the hourly chart of GBP/USD.
· USD/CAD started a major increase above the 1.2780 and 1.2800 resistance levels.
· There is a major bullish trend line forming with support near 1.2810 on the hourly chart.
GBP/USD Technical Analysis
After a major decline, the British Pound found support above 1.3180 against the US Dollar. GBP/USD started a recovery wave above the 1.3300 level, but it failed to continue higher.
A high was formed near 1.3374 on FXOpen and the pair started a fresh decline. There was a break below the 1.3320 and 1.3300 support levels. The pair traded below the 50% Fib retracement level of the upward move from the 1.3173 swing low to 1.3374 high.
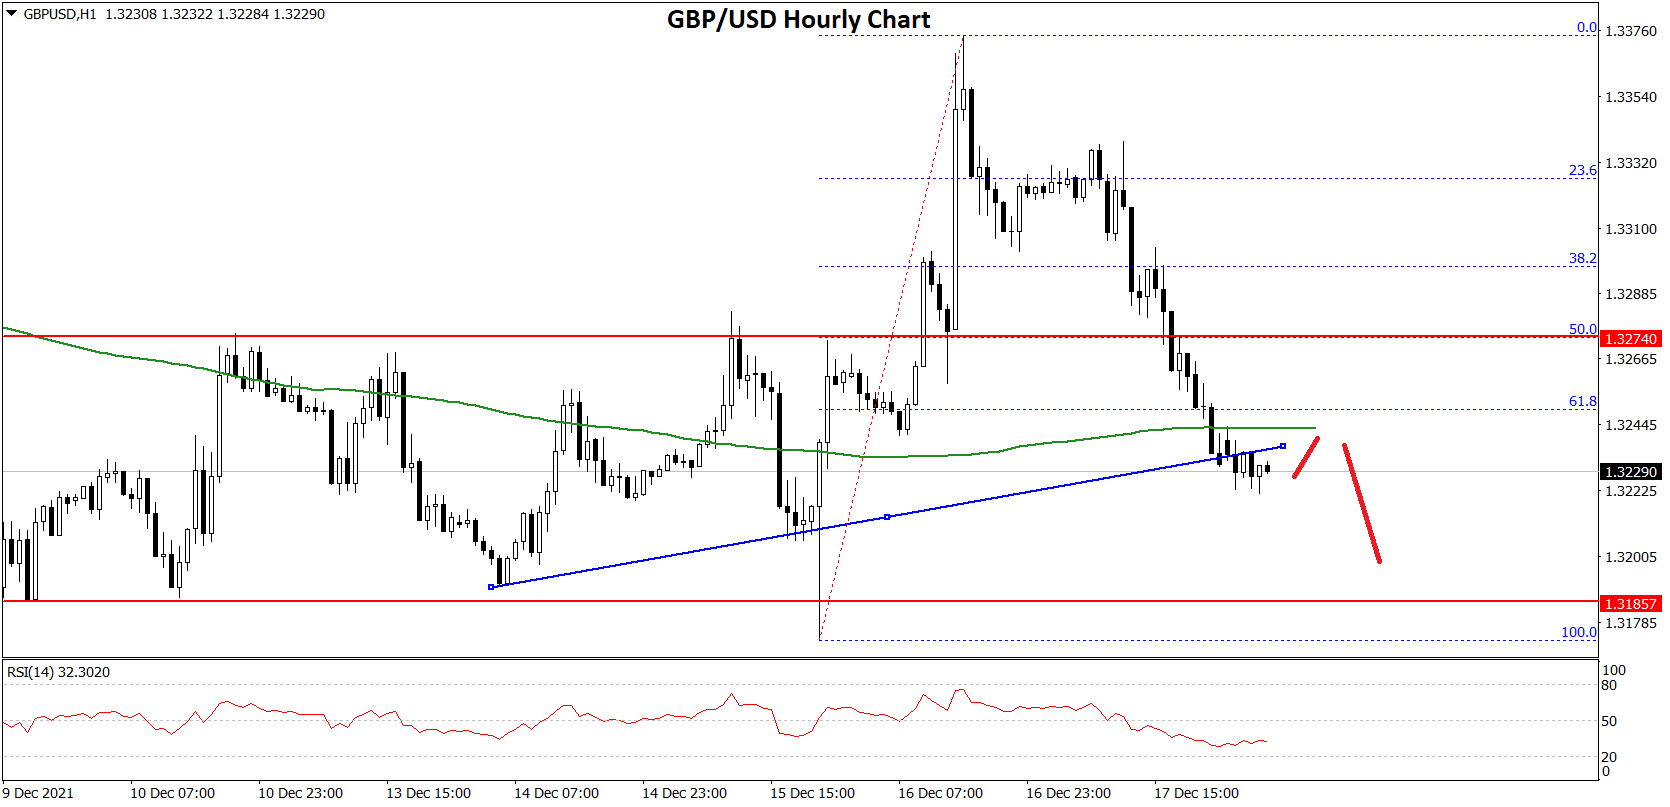
It is now trading below the 1.3250 level and the 50 hourly simple moving average. There was a break below a key bullish trend line with support near 1.3235 on the hourly chart of GBP/USD.
An immediate resistance is near the 1.3250 level. The first major resistance is near the 1.3300 level. If there is an upside break above the 1.3300 zone, the pair could rise towards 1.3350.
The next key resistance could be 1.3375, above which the pair could gain strength. On the downside, the first key support is near the 1.3220 area. It is near the 76.4% Fib retracement level of the upward move from the 1.3173 swing low to 1.3374 high.
If there is a break below 1.3220, the pair could decline extend its decline. The next key support is near the 1.3200 level. Any more losses might call for a test of the 1.3150 support.
USD/CAD Technical Analysis
The US Dollar started a fresh increase from the 1.2770 zone against the Canadian Dollar. USD/CAD gained pace for a move above the 1.2800 and 1.2820 resistance levels.
The pair even settled above 1.2850 and the 50 hourly simple moving average. The pair even climbed above the 50% Fib retracement level of the downward move from the 1.2936 high to 1.2761 low.
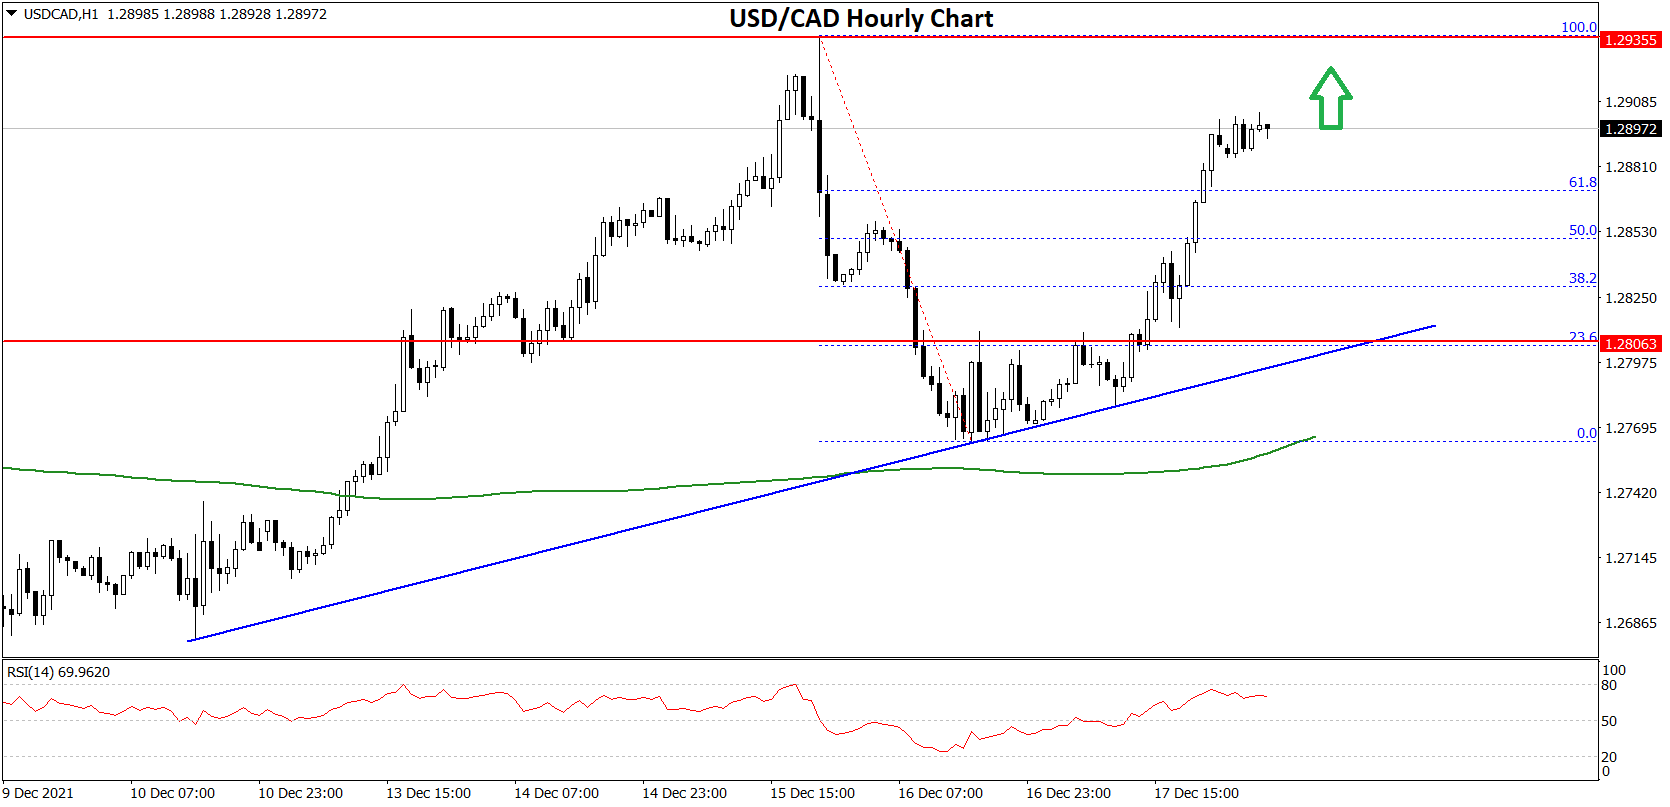
It is now trading nicely above the 1.2880 level. An initial support on the downside is near the 1.2880 level. The first major support is near the 1.2850 level. There is also a major bullish trend line forming with support near 1.2810 on the hourly chart.
The next major support is near the 1.2800 level. Any more losses may possibly open the doors for a drop towards the 1.2750 support.
An immediate hurdle on the upside is near the 1.2900 level. It is near the 76.4% Fib retracement level of the downward move from the 1.2936 high to 1.2761 low. The next major resistance is near the 1.2920 level. A clear break above the 1.2920 level could open the doors for more gains. The next major resistance is near the 1.2950 level. Any more gains could lead the pair towards the 1.3000 zone.
This forecast represents FXOpen Markets Limited opinion only, it should not be construed as an offer, invitation or recommendation in respect to FXOpen Markets Limited products and services or as financial advice.
Trade over 50 forex markets 24 hours a day with FXOpen. Take advantage of low commissions, deep liquidity, and spreads from 0.0 pips (additional fees may apply). Open your FXOpen account now or learn more about trading forex with FXOpen.
This article represents the opinion of the Companies operating under the FXOpen brand only. It is not to be construed as an offer, solicitation, or recommendation with respect to products and services provided by the Companies operating under the FXOpen brand, nor is it to be considered financial advice.
Stay ahead of the market!
Subscribe now to our mailing list and receive the latest market news and insights delivered directly to your inbox.


Latest articles

Weekly Market Insights with Gary Thomson: US Inflation, UK GDP, and US-China Meeting
In this video, we’ll explore the key economic events and market trends, shaping the financial landscape. Get ready for insights into financial markets to help you navigate the week ahead. Let’s dive in!
In this episode of Market

Silver: Structural Deficit Amid Declining Demand
Fundamental Background
The structural deficit in the silver market has now persisted for a sixth consecutive year. According to forecasts by the Silver Institute, the gap between supply and demand in 2026 is expected to reach 67 million ounces, forcing

EUR/USD — At the Crossroads of Monetary Expectations
Fundamental Background
The fundamental backdrop for EUR/USD in early May is shaped by diverging monetary policy expectations on both sides of the Atlantic. At its 30 April meeting, the ECB left interest rates unchanged; however, Governing Council members Joachim