


FXOpen
GBP/USD gained bullish momentum above the 1.2700 and 1.2800 resistance levels. Conversely, USD/CAD is under pressure and it could continue to slide below 1.3100.
Important Takeaways for GBP/USD and USD/CAD
- The British Pound is showing positive signs and is trading nicely above the 1.2850 pivot.
- There is a key bullish trend line forming with support near 1.2890 on the hourly chart of GBP/USD.
- USD/CAD declined recently and broke a few key supports near 1.3200 and 1.3180.
- There is a major bearish trend line forming with resistance near 1.3155 on the hourly chart.
GBP/USD Technical Analysis
The British Pound started a strong rise above the 1.2500 resistance area against the US Dollar. As a result, the GBP/USD pair broke many hurdles near the 1.2650 and 1.2700 levels to move into an uptrend.
The pair surpassed the key 1.2800 resistance area and the 50 hourly simple moving average. Finally, the pair rallied above the 1.2950 resistance area and traded close to the 1.3000 area.
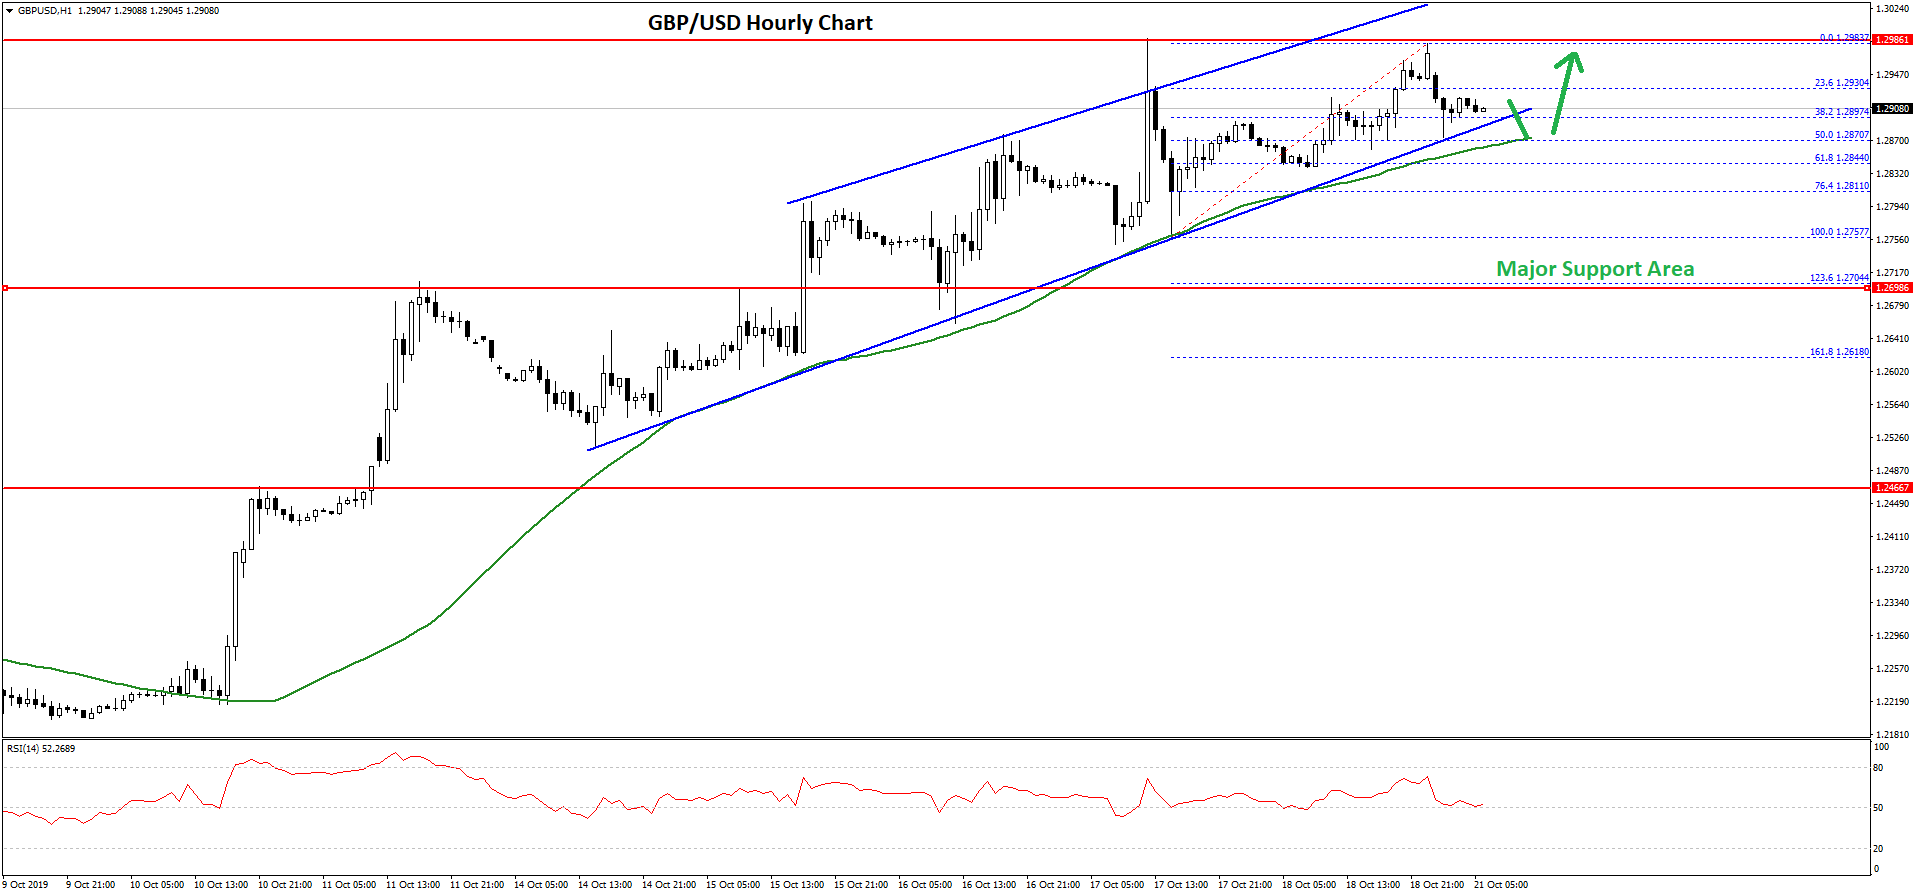
A high was formed near 1.2983 on FXOpen and the pair is currently consolidating gains. It traded below the 38.2% Fib retracement level of the recent rally from the 1.2757 low to 1.2983 high.
However, the 1.2870-1.2880 area is acting as a support. Moreover, the 50% Fib retracement level of the recent rally from the 1.2757 low to 1.2983 high is acting as a support. It seems like the pair is holding the key 1.2850 support and the 50 hourly simple moving average.
More importantly, there is a key bullish trend line forming with support near 1.2890 on the hourly chart of GBP/USD. If there is a downside break below 1.2880, the pair could continue to correct lower towards the 1.2850 support area.
Any further losses could open the doors for a drop towards the 1.2810 and 1.2800 levels. On the upside, there are key resistances near the 1.2950 and 1.2980 levels, above which GBP/USD could even rise above the 1.3000 resistance area.
USD/CAD Technical Analysis
The US Dollar started a fresh decrease from well above the 1.3300 level against the Canadian Dollar. The USD/CAD pair broke a few important supports near 1.3250 to move into a bearish zone.
The pair even broke the 1.3200 support area and the 50 hourly simple moving average. It opened the doors for more downsides and the pair traded below the 1.3150 support area. A low was formed near 1.3119 and the pair is currently consolidating losses.
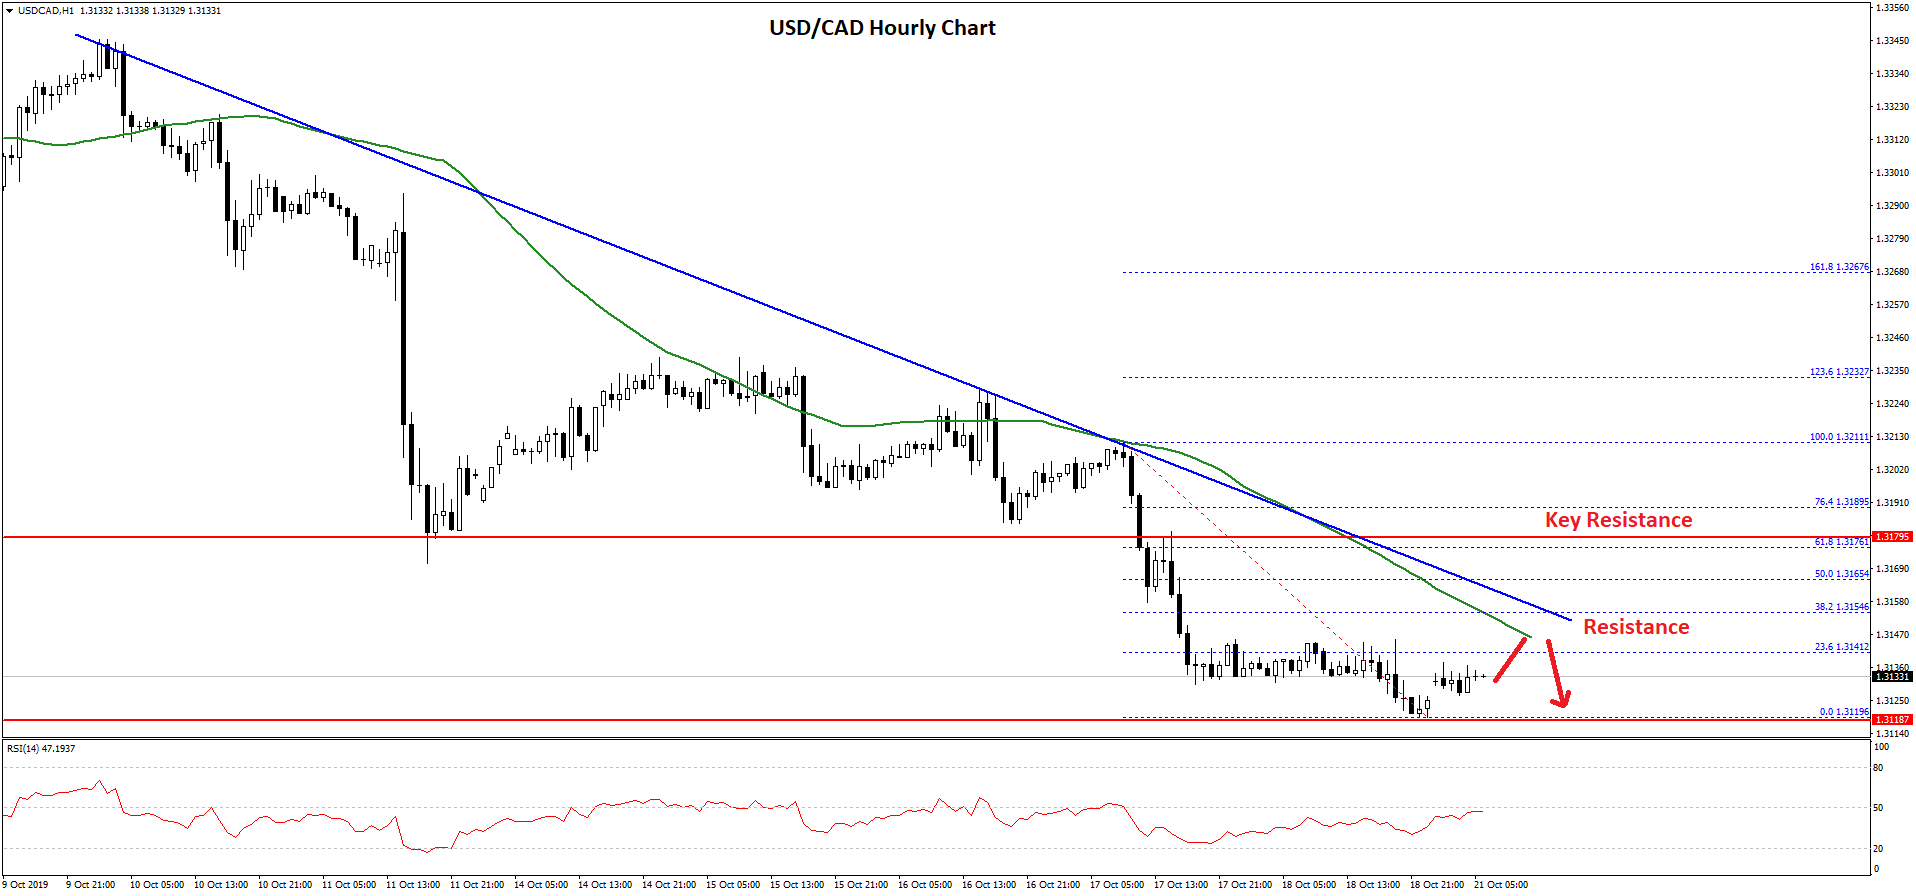
An immediate resistance is near 1.3140 or the 23.6% Fib retracement level of the recent decline from the 1.3211 high to 1.3119 low. The next key resistance is near the 1.3150 and the 50 hourly simple moving average.
Moreover, there is a major bearish trend line forming with resistance near 1.3155 on the hourly chart. Above the trend line, the pair could test the 50% Fib retracement level of the recent decline from the 1.3211 high to 1.3119 low.
The main resistance is near the 1.3180 (the previous support area). Therefore, the pair must surpass the 1.3150 and 1.3180 resistance levels to start a fresh increase in the near term.
On the downside, an immediate support is near the 1.3120 level. If USD/CAD breaks the 1.3120 support, there is a risk of a breakdown below the 1.3100 support area.
Trade over 50 forex markets 24 hours a day with FXOpen. Take advantage of low commissions, deep liquidity, and spreads from 0.0 pips. Open your FXOpen account now or learn more about trading forex with FXOpen.
This article represents the opinion of the Companies operating under the FXOpen brand only. It is not to be construed as an offer, solicitation, or recommendation with respect to products and services provided by the Companies operating under the FXOpen brand, nor is it to be considered financial advice.
Latest from Forex Analysis
Latest articles

Weekly Market Wrap With Gary Thomson: UK100, USD, GOLD, OIL
Get the latest scoop on the week's hottest headlines, all in one convenient video. Join Gary Thomson, the COO of FXOpen UK, as he breaks down the most significant news reports and shares his expert insights.
- UK100 Share Index Rises

What Is a Darvas Box Theory and How Does It Work in Trading?
The Darvas Box Theory, pioneered by Nicolas Darvas in the 1950s, has transcended its stock market origins to become a valuable tool for forex traders. This method leverages specific price movements and patterns, known as the Darvas Box, to track

NFLX Stock Price Falls Despite Subscriber Growth
Yesterday, after the close of the main trading session on the stock market, Netflix reported to investors for the 1st quarter of 2024.
The report turned out better than expected:
→ earnings per share: actual = USD 5.28, forecast = USD 4.