


FXOpen
GBP/USD is following a nice bullish path above the 1.2450 support area and it could continue to rise. USD/CAD is also trading in a positive zone and is sighting the next key break.
Important Takeaways for GBP/USD and USD/CAD
- The British Pound started a nice upward move and broke the key 1.2400 resistance area.
- There is an ascending channel forming with support near 1.2475 on the hourly chart of GBP/USD.
- USD/CAD is currently trading in a range above the key 1.3230 support area.
- There is a major contracting triangle forming with resistance near 1.3300 on the hourly chart.
GBP/USD Technical Analysis
The British Pound formed a solid support base above the 1.2280 level against the US Dollar. As a result, the GBP/USD pair started a strong upward move and broke many hurdles near the 1.2350 and 1.2400.
The pair even broke the 1.2500 resistance area and the 50 hourly simple moving average. Finally, the pair climbed above the 1.2550 level and traded to a new monthly high at 1.2581 on FXOpen.
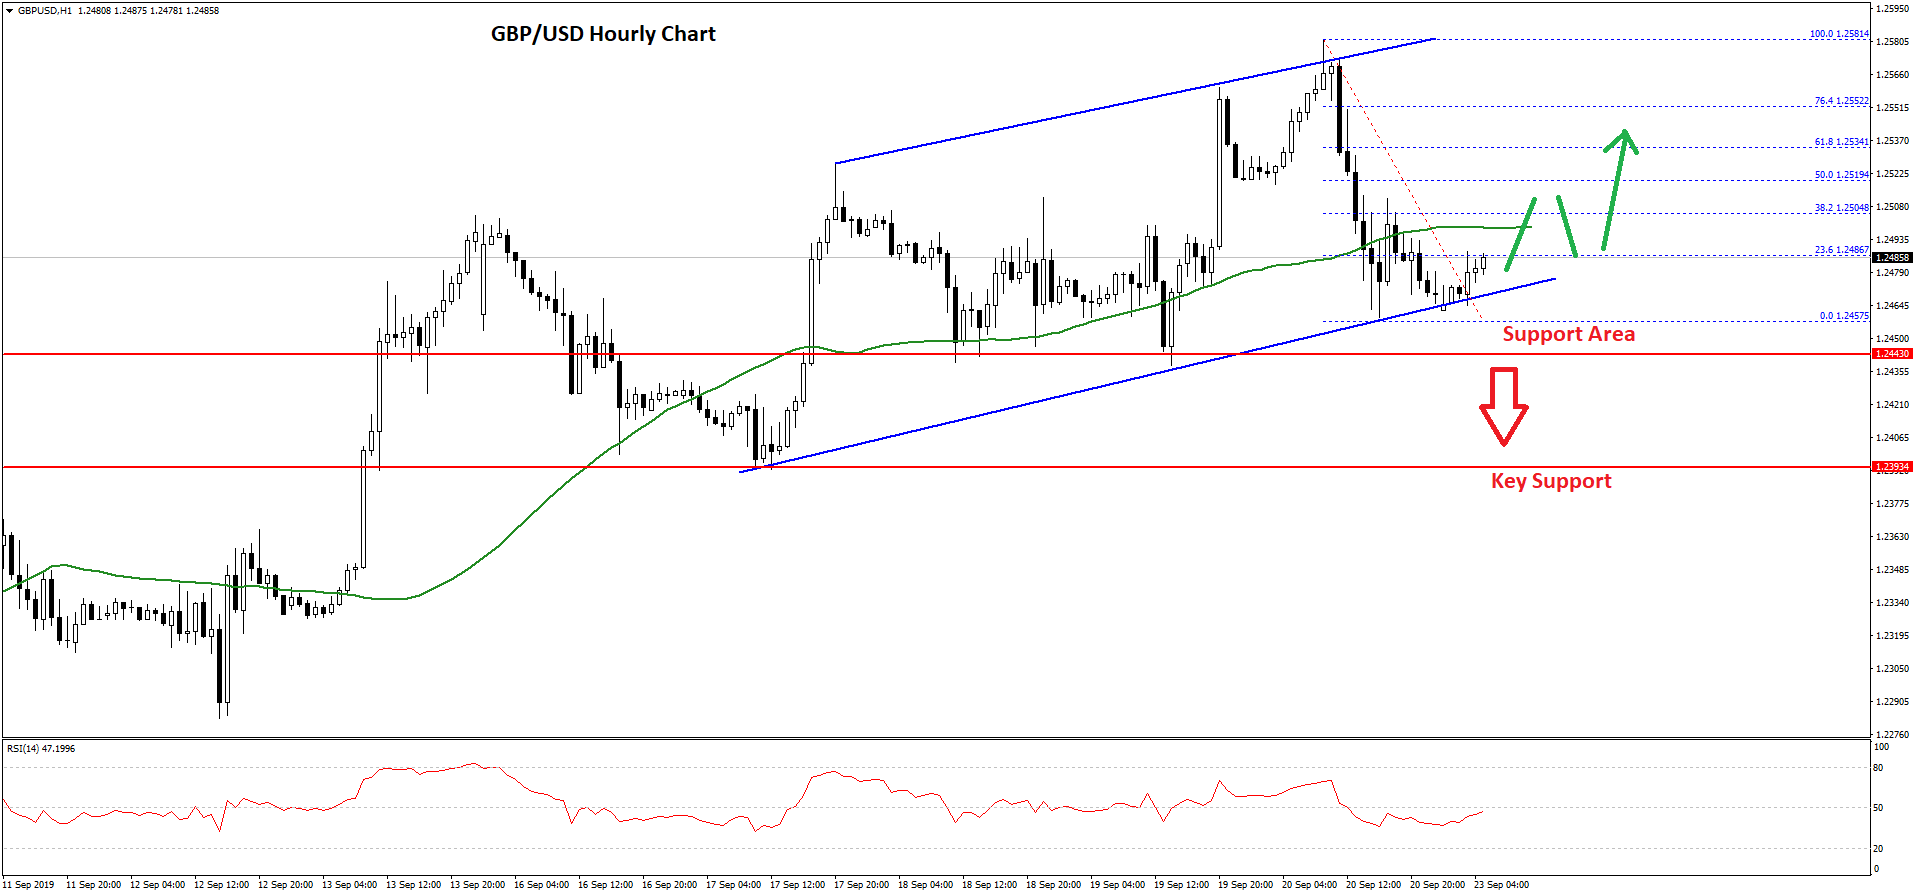
Recently, the pair started a downside correction and traded below the 1.2550 support area. There was even a break below the 1.2500 support and the 50 hourly simple moving average. A swing low was formed near 1.2457 and the pair is currently consolidating.
An immediate resistance is near the 1.2485 level, plus the 23.6% Fib retracement level of the recent drop from the 1.2581 high to 1.2457 low. However, the main resistance on the upside is near the 1.2500 and 1.2520 levels.
Moreover, the 50% Fib retracement level of the recent drop from the 1.2581 high to 1.2457 low is also near the 1.2520 level. Therefore, an upside break above the 1.2520 resistance might start a fresh increase in the coming sessions.
There is also an ascending channel forming with support near 1.2475 on the hourly chart of GBP/USD. If there is a downside break below the 1.2475 and 1.2450 support levels, the pair could start an extended downside correction towards the 1.2400 level.
USD/CAD Technical Analysis
The US Dollar climbed higher nicely from the 1.3120 support area against the Canadian Dollar. The USD/CAD pair broke the 1.3200 and 1.3220 resistance levels to move into a positive zone.
The pair even surpassed the 1.3280 level and the 50 hourly simple moving average. However, the pair faced a strong resistance near the 1.3300 area. The recent swing high was formed near 1.3300 and the pair declined below the 1.3280 level.
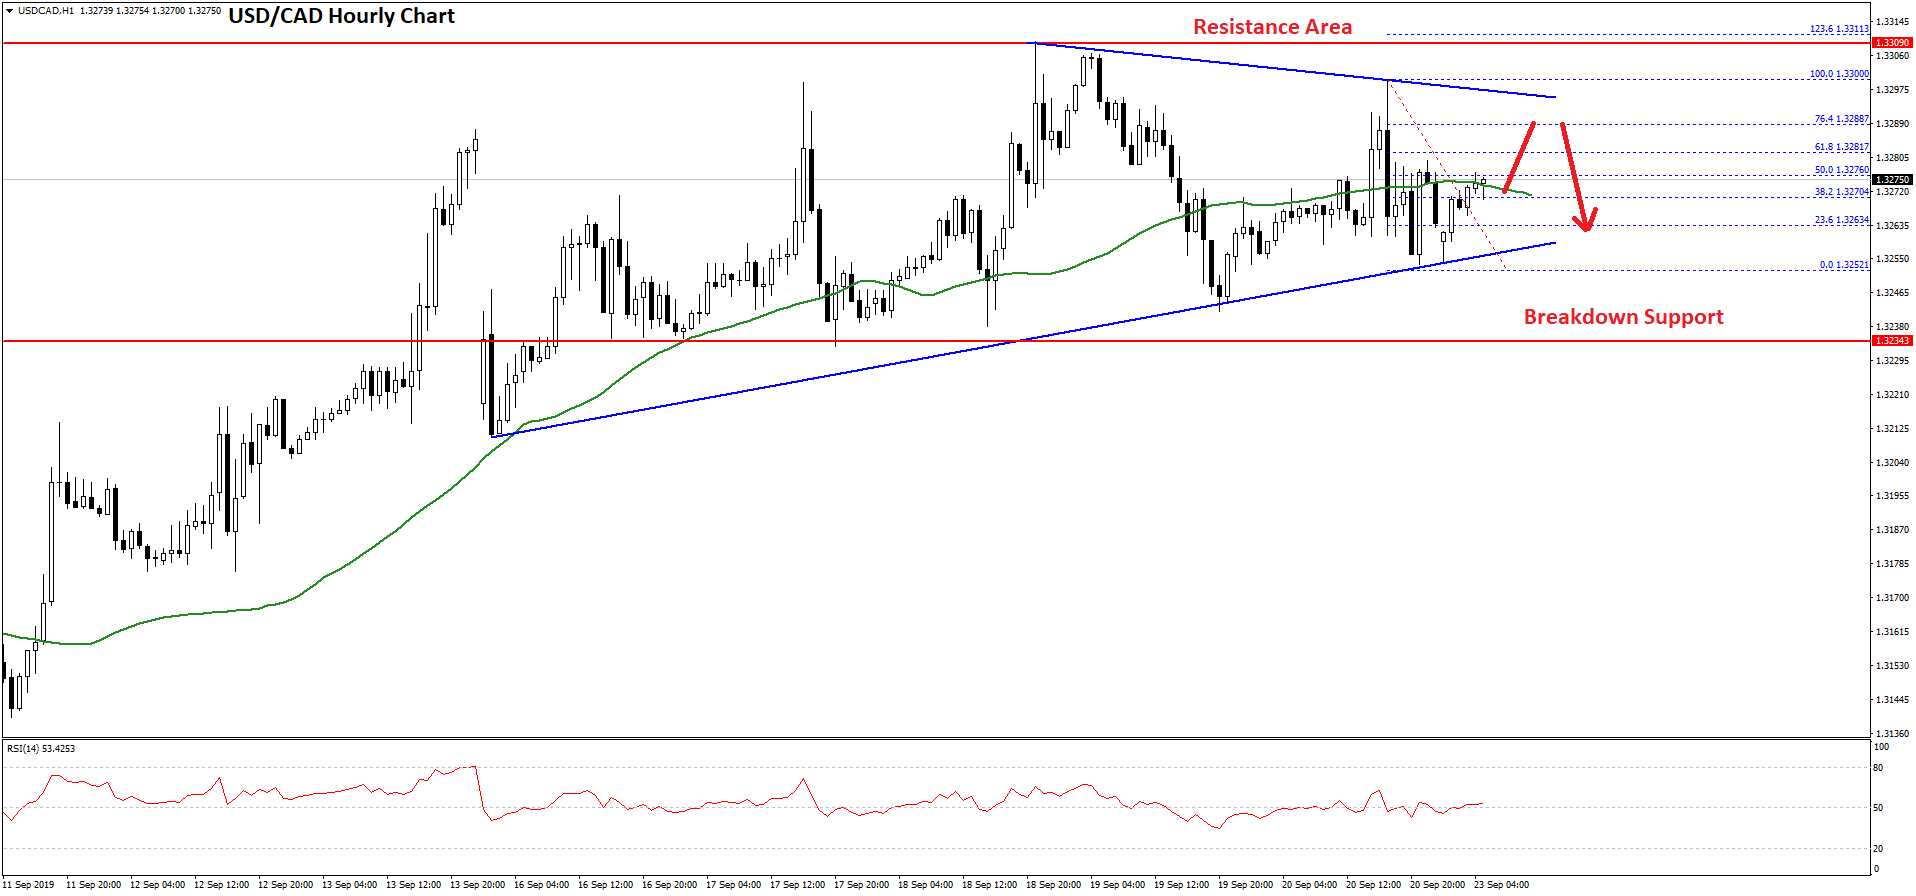
A low was formed near 1.3252 and the pair is currently correcting higher. It broke the 23.6% Fib retracement level of the last slide from the 1.3300 high to 1.3252 low.
At the moment, the pair is testing the 1.3275 resistance, plus the 50% Fib retracement level of the last slide from the 1.3300 high to 1.3252 low. Moreover, there is a major contracting triangle forming with resistance near 1.3300 on the hourly chart.
On the upside, the main resistance is near the 1.3300 level. A convincing break above the 1.3300 resistance will most likely open the doors for another rise towards the 1.3400 level in the near term.
On the downside, there are many important supports near the 1.3250 and 1.3230 levels. A daily close below the 1.3230 support area might push USD/CAD in a bearish zone. The next key support is near the 1.3180 level.
Trade over 50 forex markets 24 hours a day with FXOpen. Take advantage of low commissions, deep liquidity, and spreads from 0.0 pips. Open your FXOpen account now or learn more about trading forex with FXOpen.
This article represents the opinion of the Companies operating under the FXOpen brand only. It is not to be construed as an offer, solicitation, or recommendation with respect to products and services provided by the Companies operating under the FXOpen brand, nor is it to be considered financial advice.
Stay ahead of the market!
Subscribe now to our mailing list and receive the latest market news and insights delivered directly to your inbox.


Latest articles


XBR/USD Chart Analysis: Price Rebounds from a Seven-Week Low
On 1 December, we outlined a descending channel on the XBR/USD chart and noted that the bearish trend was driven by fading geopolitical risks. Indeed, hopes for an end to the war in Ukraine—along with the possibility of

Silver Price Hits Historic Record Around $64
On 27 November, we suggested that silver was preparing to challenge its all-time high. Since then (marked with the orange arrow), XAG/USD has risen by roughly 18%, breaking above the psychological $60-per-ounce threshold for the first time in history.