


FXOpen
GBP/USD is facing many hurdles near the 1.2700 and 1.2800 resistance levels. Similarly, USD/CAD is trading below the key 1.3350-60 resistance zone.
Important Takeaways for GBP/USD and USD/CAD
- The British Pound is following a steady bearish path below the 1.2800 resistance.
- There is a major bearish trend line in place with resistance near the 1.2780 level on the hourly chart of GBP/USD.
- USD/CAD is currently trading below the 1.3350 and 1.3360 resistance levels.
- The pair is facing an important bearish trend line with resistance near 1.3350 on the hourly chart.
GBP/USD Technical Analysis
Recently, the British Pound made many attempts to settle above the 1.2800 and 1.2810 resistance levels against the US Dollar. However, the GBP/USD pair failed to gain momentum above 1.2815 and later declined.
The last swing high was formed at 1.2808 on FXOpen and later the pair started a downside move. It declined below the 1.2750 support and the 50 hourly simple moving average.
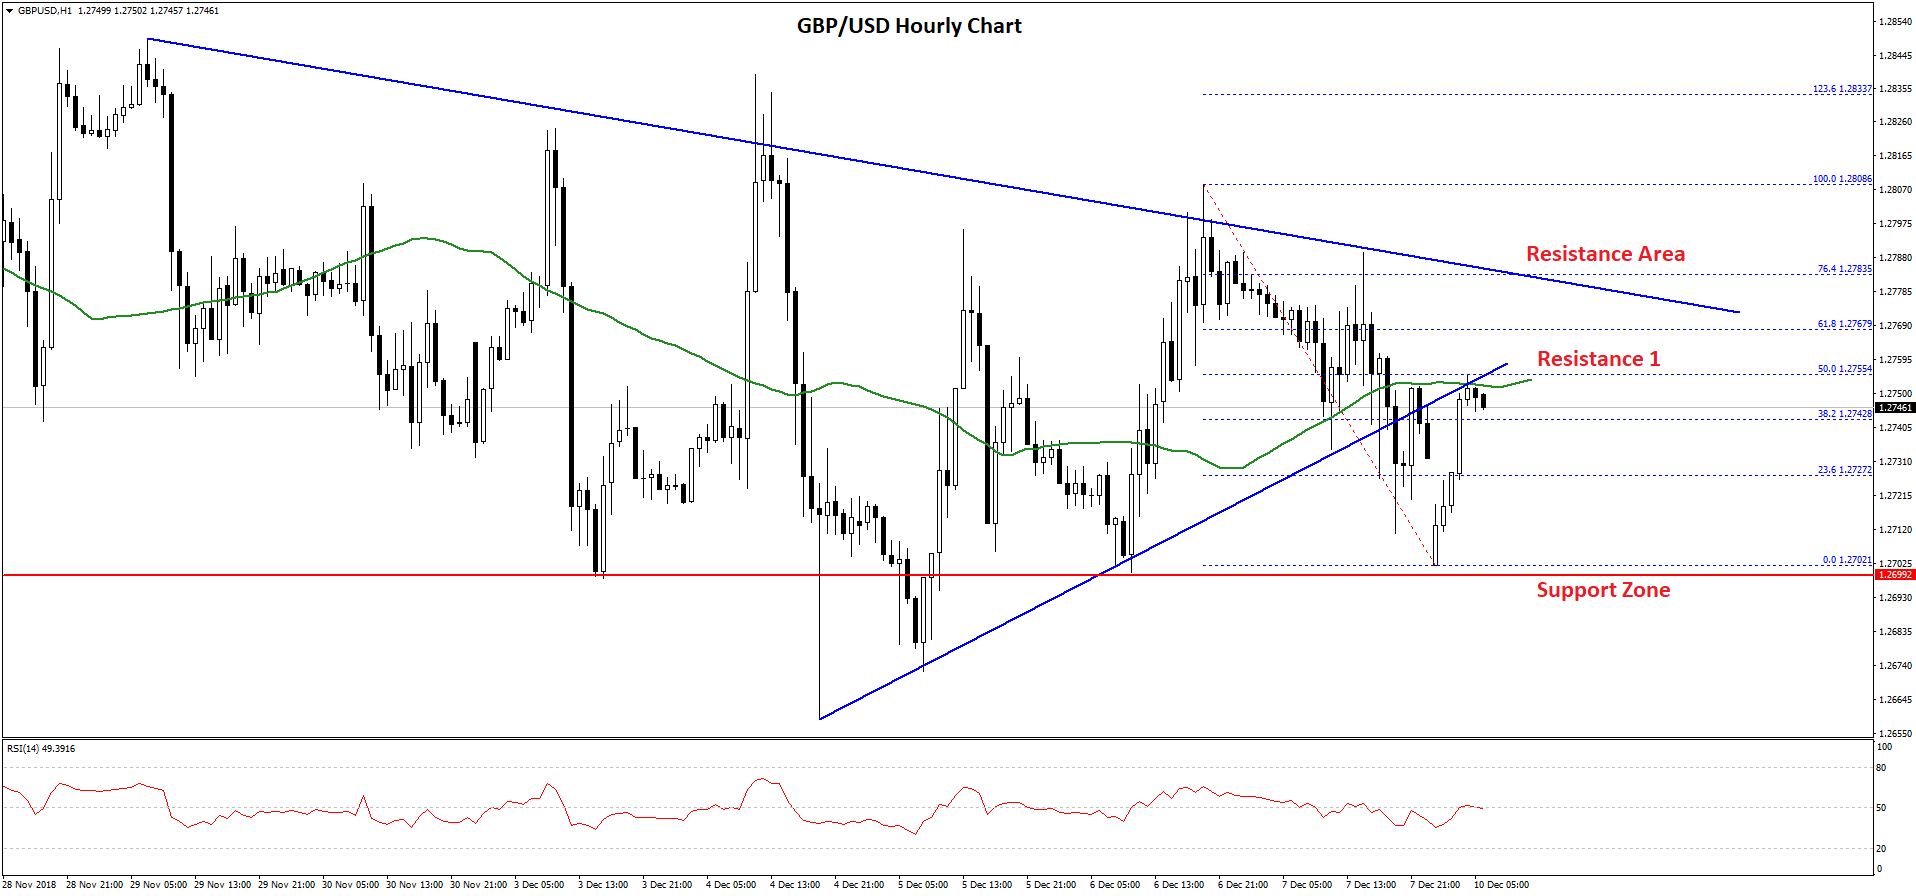
The decline was such that the pair traded close to the 1.2700 level and a low was formed at 1.2702. Later, the pair corrected higher and traded above the 1.2740 level. It also moved above the 38.2% Fib retracement level of the recent decline from the 1.2808 high to 1.2702 low.
However, the pair failed to clear the 1.2755 level and the 50 hourly SMA. More importantly, the 50% Fib retracement level of the recent decline from the 1.2808 high to 1.2702 low acted as a solid barrier for buyers.
Above 1.2755, there is a major bearish trend line in place with resistance near the 1.2780 level on the hourly chart. Therefore, if the pair corrects above the 1.2755-60 zone, it could face a lot of selling interest near the 1.2780 level.
Overall, GBP/USD remains in a downtrend unless buyers push the pair above 1.2780 and 1.2800. On the downside, an initial support is at 1.2720, below which the pair could retest the 1.2700 area in the near term.
USD/CAD Technical Analysis
The US Dollar gained bullish momentum this past week and traded above the 1.3250 and 1.3300 resistance levels against the Canadian Dollar. The USD/CAD pair even climbed above the 1.3400 barrier before sellers appeared near the 1.3440 level.
A high was formed near the 1.3444 level and later the pair corrected lower sharply. It declined below the 1.3350 and 1.3300 support levels. It tested the 1.3250 support and settled below the 50 hourly simple moving average.
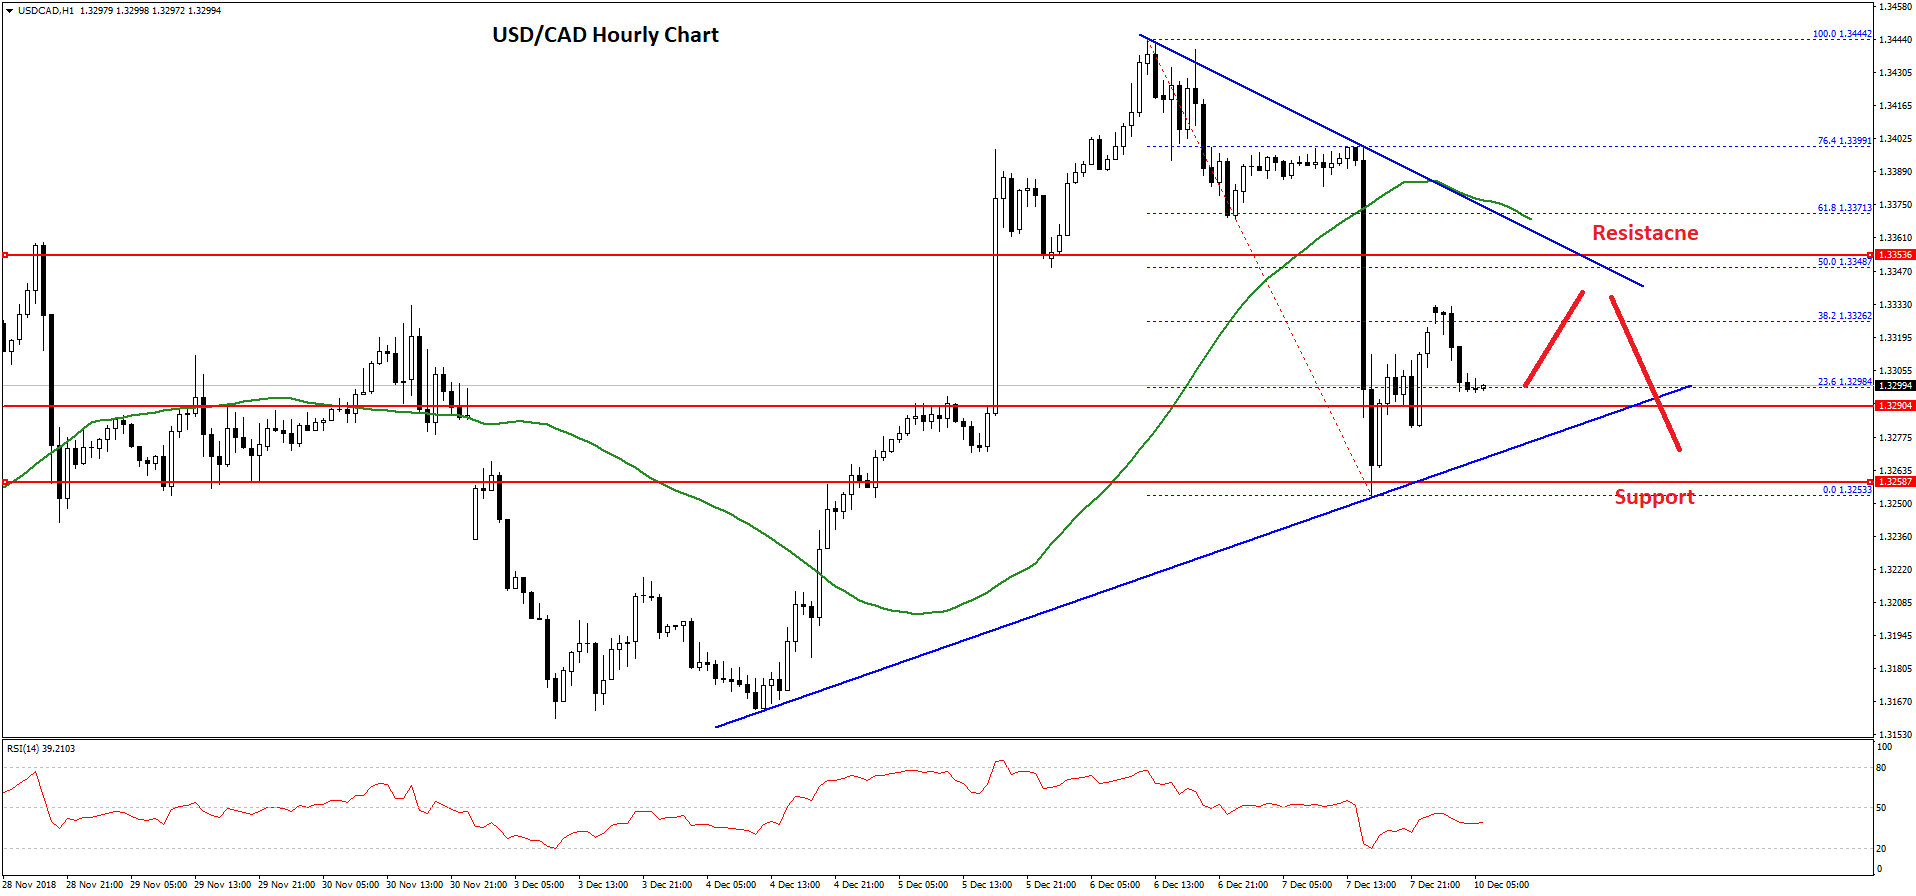
At the moment, the pair is correcting above the 1.3300 level and the 23.6% Fib retracement level of the recent decline from the 1.3444 high to 1.3253 low. However, there are many hurdles on the upside near the 1.3330 and 1.3350 levels.
There is also an important bearish trend line formed with resistance near 1.3350 on the hourly chart. Above the trend line, the 50 hourly SMA is positioned at 1.3370. Below the trend line, the 50% Fib retracement level of the recent decline from the 1.3444 high to 1.3253 low is at 1.3348.
Therefore, if the pair corrects further higher, it could face a strong resistance near 1.3345-50. On the downside, an initial support is near 1.3290 and a bullish trend line on the same chart. However, the key support is at 1.3250, below which USD/CAD might retest 1.3200.
Trade over 50 forex markets 24 hours a day with FXOpen. Take advantage of low commissions, deep liquidity, and spreads from 0.0 pips. Open your FXOpen account now or learn more about trading forex with FXOpen.
This article represents the opinion of the Companies operating under the FXOpen brand only. It is not to be construed as an offer, solicitation, or recommendation with respect to products and services provided by the Companies operating under the FXOpen brand, nor is it to be considered financial advice.
Latest from Forex Analysis
Latest articles

Since the Start of the Week, Brent Oil Price Has Dropped over 4%
At the beginning of the week, March 15, we wrote that the price of Brent oil could form a correction from the resistance level of USD 91 per barrel. Since then, the price has decreased by more than 4% due

Fair Value Gaps vs Liquidity Voids in Trading
Understanding fair value gaps and liquidity voids is essential for traders seeking to navigate the complexities of the financial markets. These concepts, deeply rooted in the Smart Money Concept (SMC), provide valuable insights into the dynamics of supply and demand,

UK100 Share Index Rises as UK Inflation Slows
Yesterday, the UK Office for National Statistics (ONS) reported that the CPI stood at 3.2% in March. According to ForexFactory, analysts expected 3.1%, and a month ago the index was 3.4%.
Grant Fitzner, chief economist at the