


FXOpen

GBP/USD started a fresh decline after it failed to clear the 1.3175 resistance zone. GBP/JPY is also declining and it is showing bearish signs below the 137.00 level.
Important Takeaways for GBP/USD and GBP/JPY
- The British Pound faced a heavy resistance near 1.3175 and declined below 1.3100.
- There is a key bearish trend line forming with resistance near 1.3060 on the hourly chart of GBP/USD.
- GBP/JPY is also showing bearish signs below the 137.00 and 137.20 resistance levels.
- There was a break below a major bullish trend line with support near 137.10 on the hourly chart.
GBP/USD Technical Analysis
This past week, the British Pound gained momentum above the 1.3000 resistance against the US Dollar. The GBP/USD pair broke the 1.3100 and 1.3120 resistance levels.
However, it struggled to gain momentum above the 1.3175 resistance level. A high was formed near 1.3177 on FXOpen and it started a fresh decline. There was a break below the 1.3100 support level and the 50 hourly simple moving average.
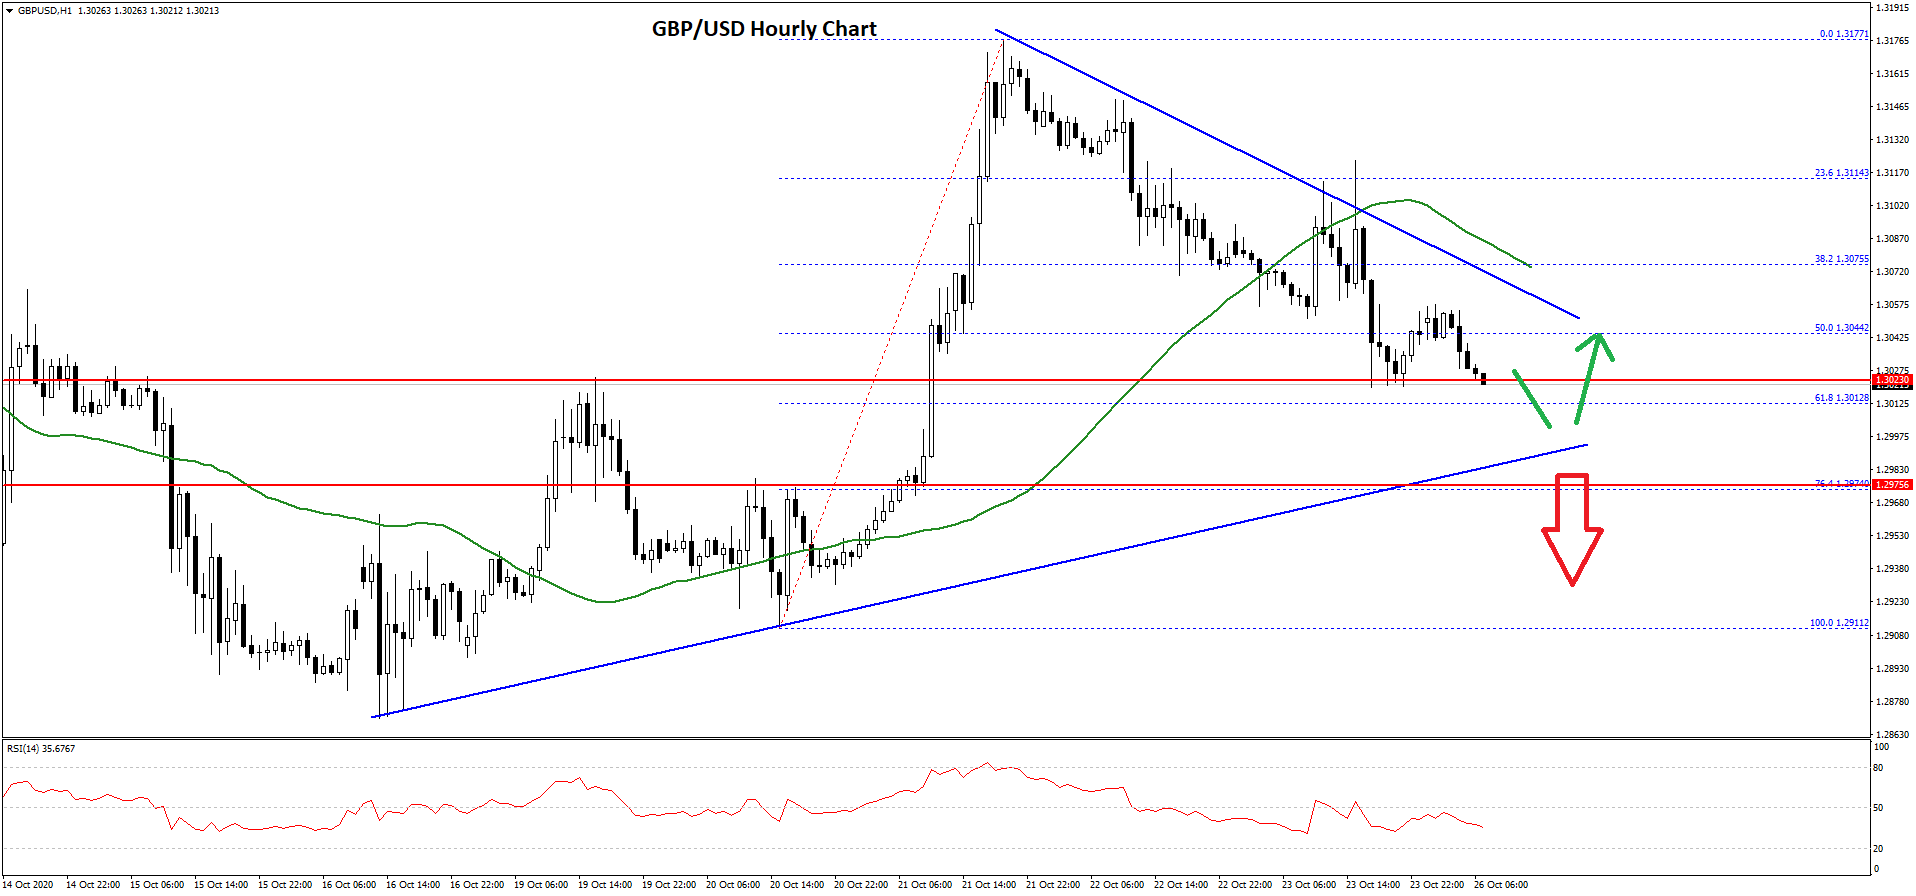
The decline was such that the pair even broke the 50% Fib retracement level of the upward move from the 1.2911 swing low to 1.3177 high. It is now testing the 1.3020 support level.
An immediate support is near the 1.3010 level. It is close to the 61.8% Fib retracement level of the upward move from the 1.2911 swing low to 1.3177 high. There is also a connecting bullish trend line with support at 1.3000 on the hourly chart of GBP/USD.
If there is a downside break below the 1.3020 and 1.3000 support levels, there is a risk of a sharp decline. The next major support is near the 1.2950 level.
On the upside, the first major hurdles for the bulls is near the 1.3050 level. Moreover, there is a key bearish trend line forming with resistance near 1.3060 on the same chart. A clear break above 1.3050 and 1.3060 is needed for a fresh increase in the near term.
GBP/JPY Technical Analysis
The British Pound also faced a strong resistance near 137.65 and started a fresh decline against the Japanese Yen. The GBP/JPY pair broke the 137.20 support level to move into a bearish zone.
There was also a close below the 137.00 level and the 50 hourly simple moving average. Besides, there was a break below a major bullish trend line with support near 137.10 on the hourly chart.
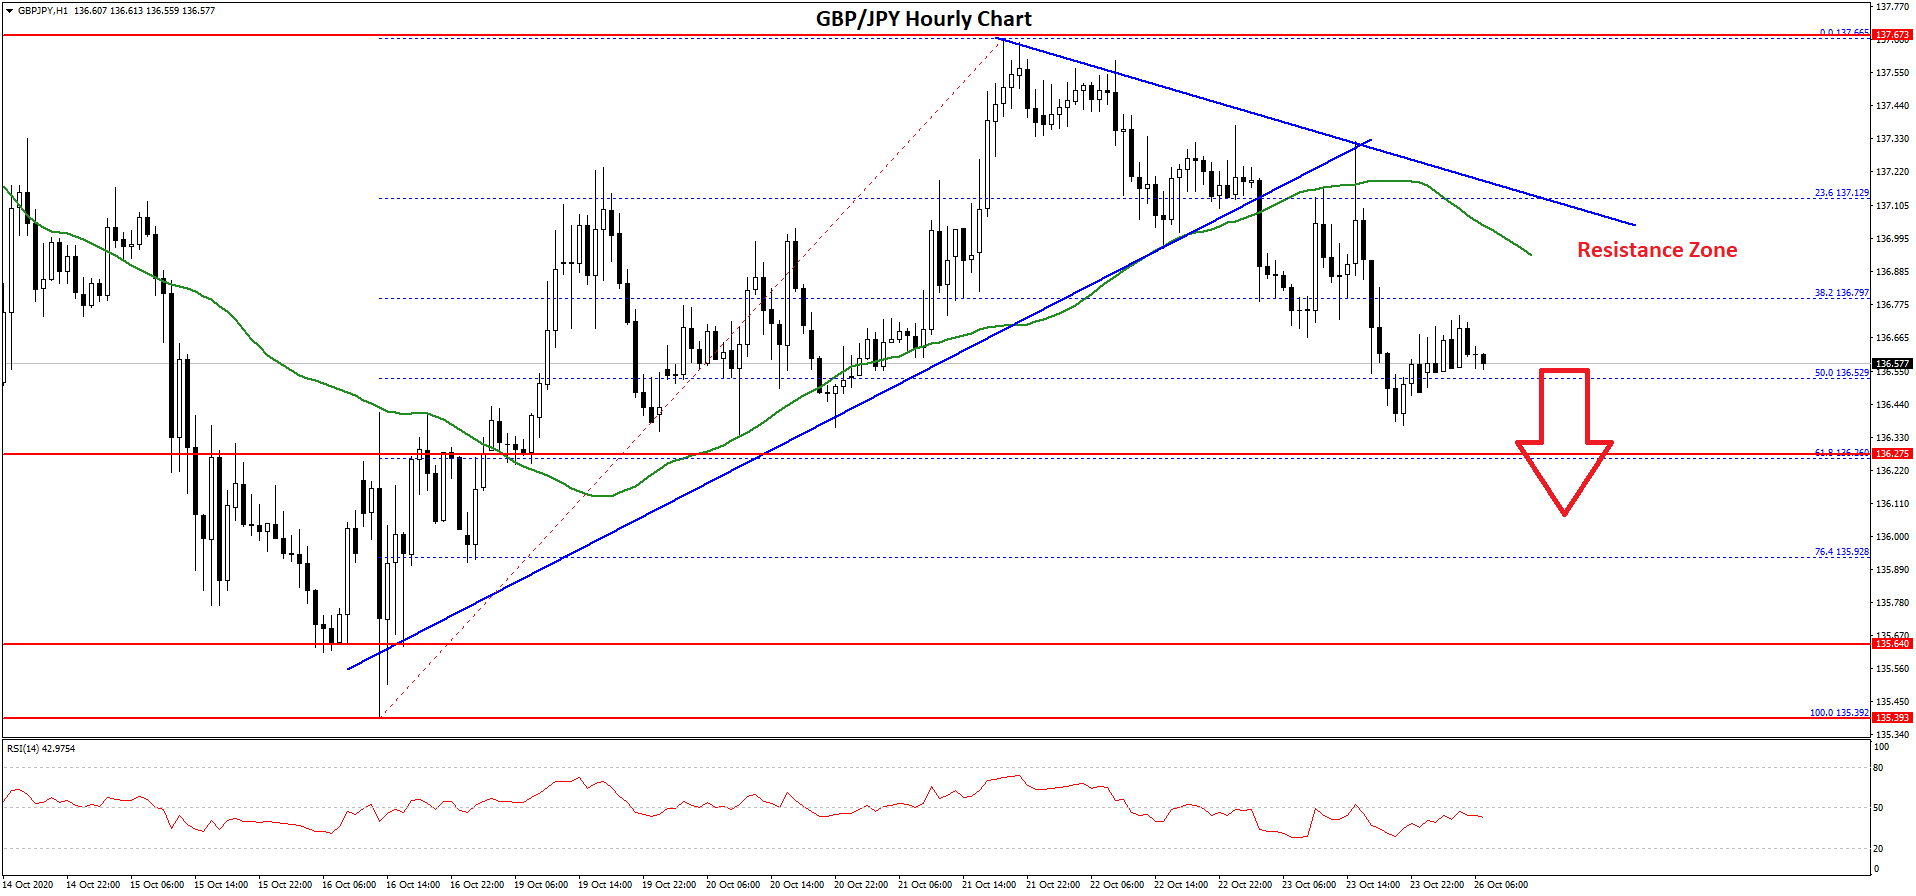
The pair even traded below the 50% Fib retracement level of the upward move from the 135.39 low to 137.66 high. On the downside, there are many supports, starting with 136.40 and 136.30.
The 61.8% Fib retracement level of the upward move from the 135.39 low to 137.66 high is also near the 136.35 level. If there is a downside break below the 136.35 and 136.00 support levels, there is a risk of a larger decline in the coming sessions.
The next major support is near the 136.00 zone. On the upside, the pair is facing hurdles near the 137.00 and 137.20 levels.
There is also a connecting bearish trend line forming with resistance near 137.10 and the 50 hourly simple moving average. A clear break above the 137.10 and 137.20 resistance levels is needed to start a fresh increase.
Trade over 50 forex markets 24 hours a day with FXOpen. Take advantage of low commissions, deep liquidity, and spreads from 0.0 pips. Open your FXOpen account now or learn more about trading forex with FXOpen.
This article represents the opinion of the Companies operating under the FXOpen brand only. It is not to be construed as an offer, solicitation, or recommendation with respect to products and services provided by the Companies operating under the FXOpen brand, nor is it to be considered financial advice.
Latest from Forex Analysis
Latest articles

Weekly Market Wrap With Gary Thomson: UK100, USD, GOLD, OIL
Get the latest scoop on the week's hottest headlines, all in one convenient video. Join Gary Thomson, the COO of FXOpen UK, as he breaks down the most significant news reports and shares his expert insights.
- UK100 Share Index Rises

What Is a Darvas Box Theory and How Does It Work in Trading?
The Darvas Box Theory, pioneered by Nicolas Darvas in the 1950s, has transcended its stock market origins to become a valuable tool for forex traders. This method leverages specific price movements and patterns, known as the Darvas Box, to track

NFLX Stock Price Falls Despite Subscriber Growth
Yesterday, after the close of the main trading session on the stock market, Netflix reported to investors for the 1st quarter of 2024.
The report turned out better than expected:
→ earnings per share: actual = USD 5.28, forecast = USD 4.