


FXOpen

GBP/USD started a decent increase from the 1.2849 low and recovered above 1.2950. GBP/JPY is trading nicely in a positive zone above 144.00 and it could continue to rise.
Important Takeaways for GBP/USD and GBP/JPY
- The British Pound recovered nicely above the 1.2920 and 1.2940 resistance levels.
- There is a key bearish trend line in place with resistance near 1.2995 on the hourly chart of GBP/USD.
- GBP/JPY is currently correcting lower from the 144.95 weekly high.
- There is a major bullish trend line forming with support near 144.20 on the hourly chart.
GBP/USD Technical Analysis
This past week, the British Pound declined towards the 1.2850 support area against the US Dollar. However, the GBP/USD pair remained well bid near 1.2850 and 1.2855.
A low was formed near 1.2849 on FXOpen and the pair started a fresh increase. It surpassed the 1.2920 and 1.2940 resistance levels to move into a short term positive zone.
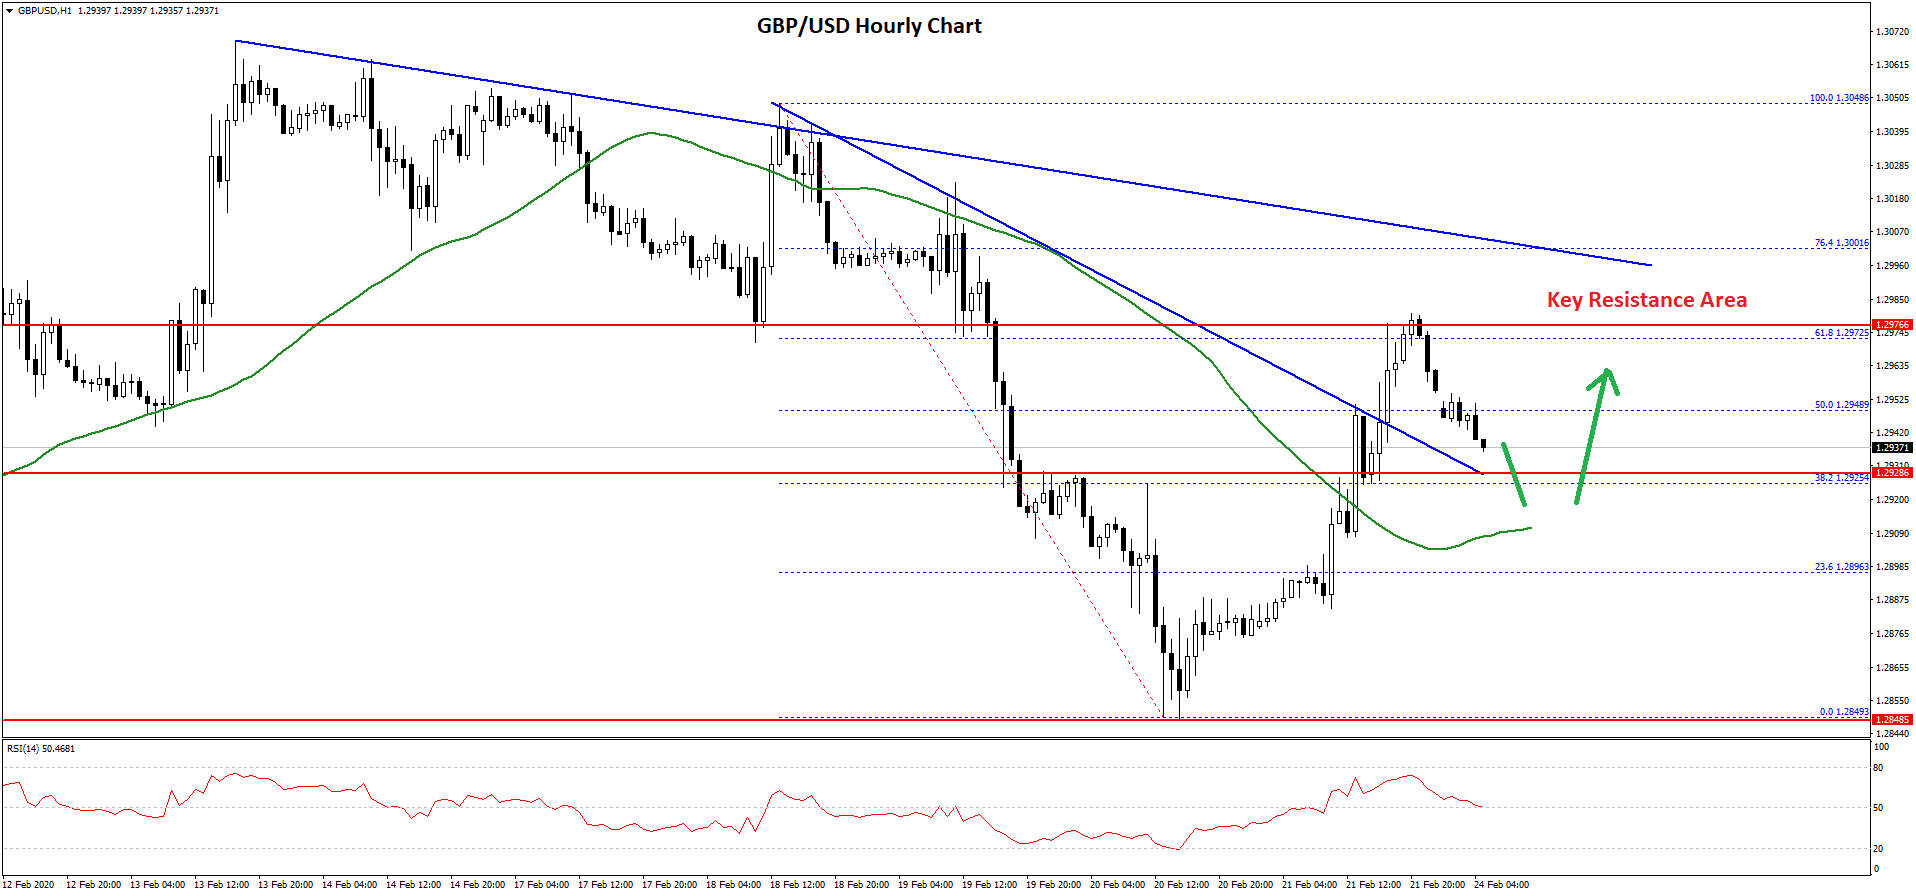
The pair traded above the 50% Fib retracement level of the downward move from the 1.3048 high to 1.2849 low. During the rise, there was a break above a connecting bearish trend line with resistance near 1.2948 on the hourly chart.
Besides, the pair settled above 1.2920 and the 50 hourly simple moving average. However, the pair failed to climb above the 1.2980 and 1.3000 resistance levels.
The 76.4% Fib retracement level of the downward move from the 1.3048 high to 1.2849 low also prevented gains. More importantly, there is a key bearish trend line in place with resistance near 1.2995 on the hourly chart of GBP/USD.
The pair is currently declining, but it could find bids near the 1.2925 and 1.2910 support levels. Any further losses may lead the pair back towards 1.2850.
On the upside, an initial resistance is near the 1.2980 level. However, the GBP/USD pair must surpass the 1.3000 resistance area to continue higher towards the 1.3050 and 1.3080 levels in the near term.
GBP/JPY Technical Analysis
The British Pound followed a nice bullish path from the 142.50 support area against the Japanese Yen. The GBP/JPY pair broke a few important hurdles near the 143.50 level to move into a positive zone.
Moreover, there was a close above the 144.00level and the 50 hourly simple moving average. It opened the doors for more gains above the 144.50 and 144.60 levels.
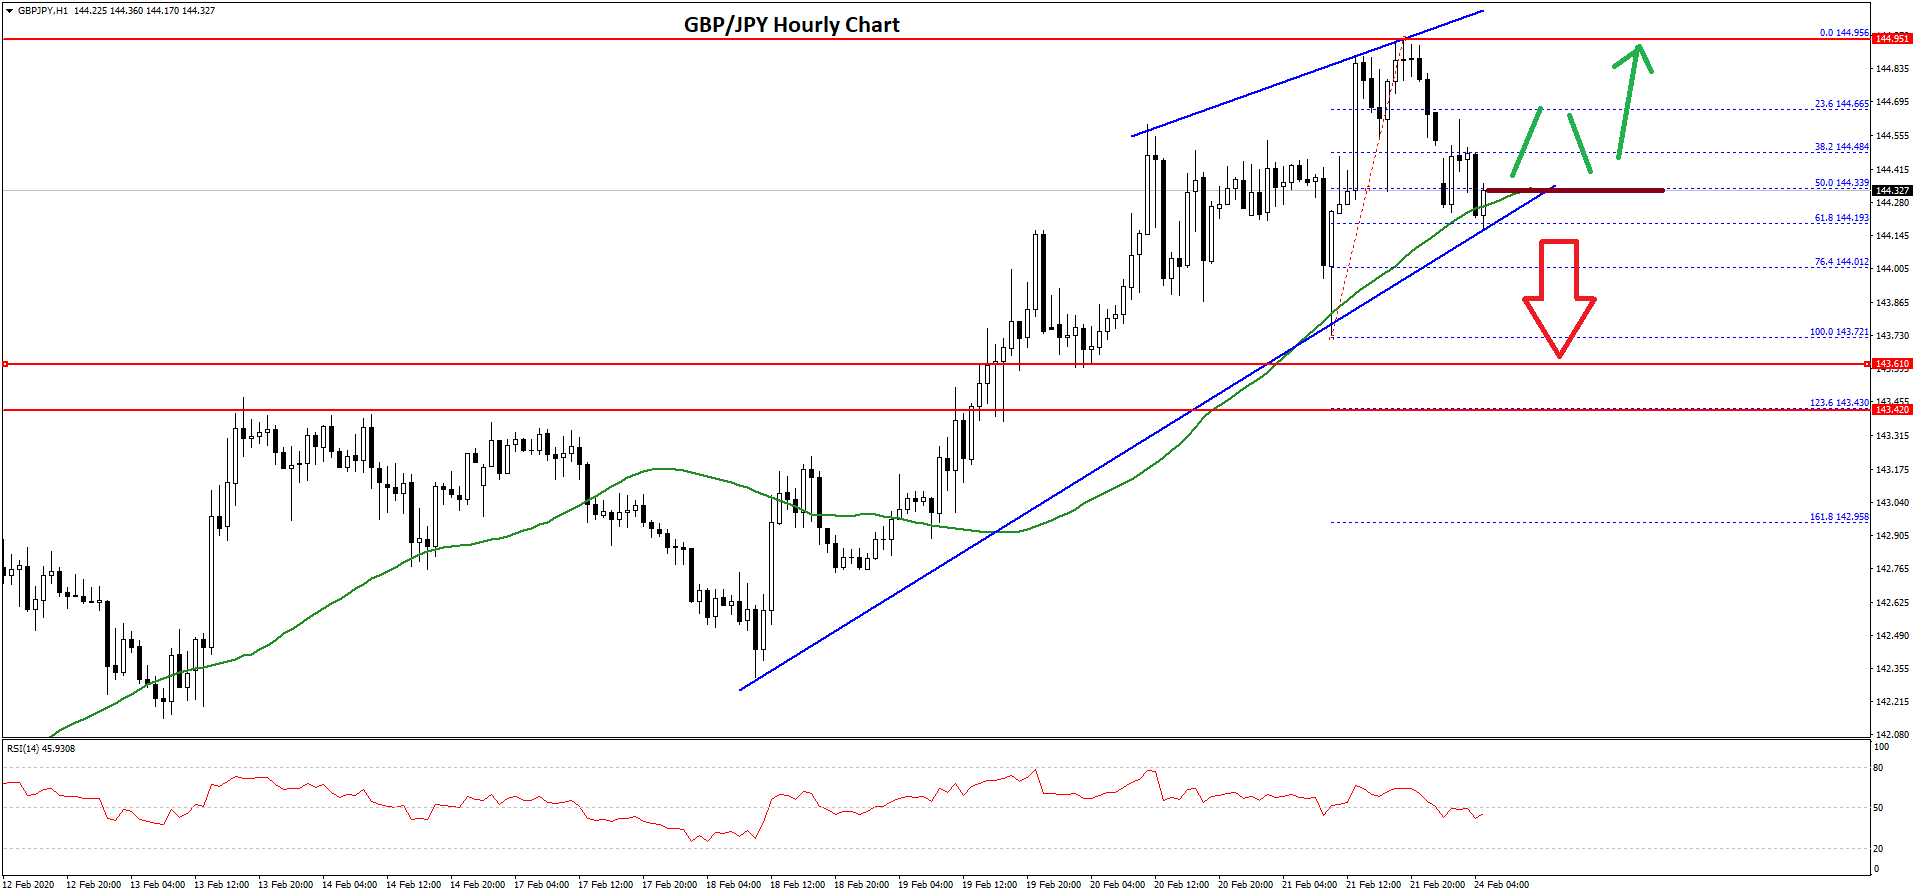
The pair traded close to the 145.00 resistance and a swing high is formed near the 144.95 level. Recently, the pair started a fresh decline and traded below the 144.80 level.
Besides, there was a break below the 50% Fib retracement level of the upward move from the 143.72 low to 144.95 high. However, there is a decent support waiting near the 144.20 level and the 50 hourly simple moving average.
Moreover, there is a major bullish trend line forming with support near 144.20 on the hourly chart. The 61.8% Fib retracement level of the upward move from the 143.72 low to 144.95 high is also providing support.
Therefore, the pair could continue to rise towards the 144.90 and 145.00 levels in the near term. Any further gains could lead GBP/JPY towards the 145.40 level.
On the downside, the key support is near the 144.20 area, below which the pair could correct lower towards the 143.45 level.
Trade over 50 forex markets 24 hours a day with FXOpen. Take advantage of low commissions, deep liquidity, and spreads from 0.0 pips. Open your FXOpen account now or learn more about trading forex with FXOpen.
This article represents the opinion of the Companies operating under the FXOpen brand only. It is not to be construed as an offer, solicitation, or recommendation with respect to products and services provided by the Companies operating under the FXOpen brand, nor is it to be considered financial advice.
Latest from Forex Analysis
Latest articles

Market Analysis: AUD/USD and NZD/USD Turn Red
AUD/USD declined below the 0.6500 and 0.6455 support levels. NZD/USD is also moving lower and might struggle to recover above 0.5950.
Important Takeaways for AUD/USD and NZD/USD Analysis Today
· The Aussie Dollar started

Since the Start of the Week, Brent Oil Price Has Dropped over 4%
At the beginning of the week, March 15, we wrote that the price of Brent oil could form a correction from the resistance level of USD 91 per barrel. Since then, the price has decreased by more than 4% due

Fair Value Gaps vs Liquidity Voids in Trading
Understanding fair value gaps and liquidity voids is essential for traders seeking to navigate the complexities of the financial markets. These concepts, deeply rooted in the Smart Money Concept (SMC), provide valuable insights into the dynamics of supply and demand,