


GBP/USD and GBP/JPY At Risk of More Downsides
FXOpen
GBP/USD started a fresh decline and traded below the 1.3300 support zone. GBP/JPY is also trading in a bearish zone and is facing hurdles near 150.00.
Important Takeaways for GBP/USD and GBP/JPY
· The British Pound started a fresh decline after it faced sellers near 1.3360 against the US Dollar.
· There is a major bearish trend line forming with resistance near 1.3280 on the hourly chart of GBP/USD.
· GBP/JPY also declined heavily below the 150.00 and 150.00 support levels.
· There is a key bearish trend line forming with resistance near 150.65 on the hourly chart.
GBP/USD Technical Analysis
This past week, the British Pound started a fresh decline after it failed near 1.3360 against the US Dollar. The GBP/USD pair broke the 1.3320 and 1.3300 support levels to enter a bearish zone.
There was also a break below the 1.3260 support zone and the 50 hourly simple moving average. It traded as low as 1.3207 on FXOpen and is currently consolidating losses. It recovered a few points above the 1.3230 level.
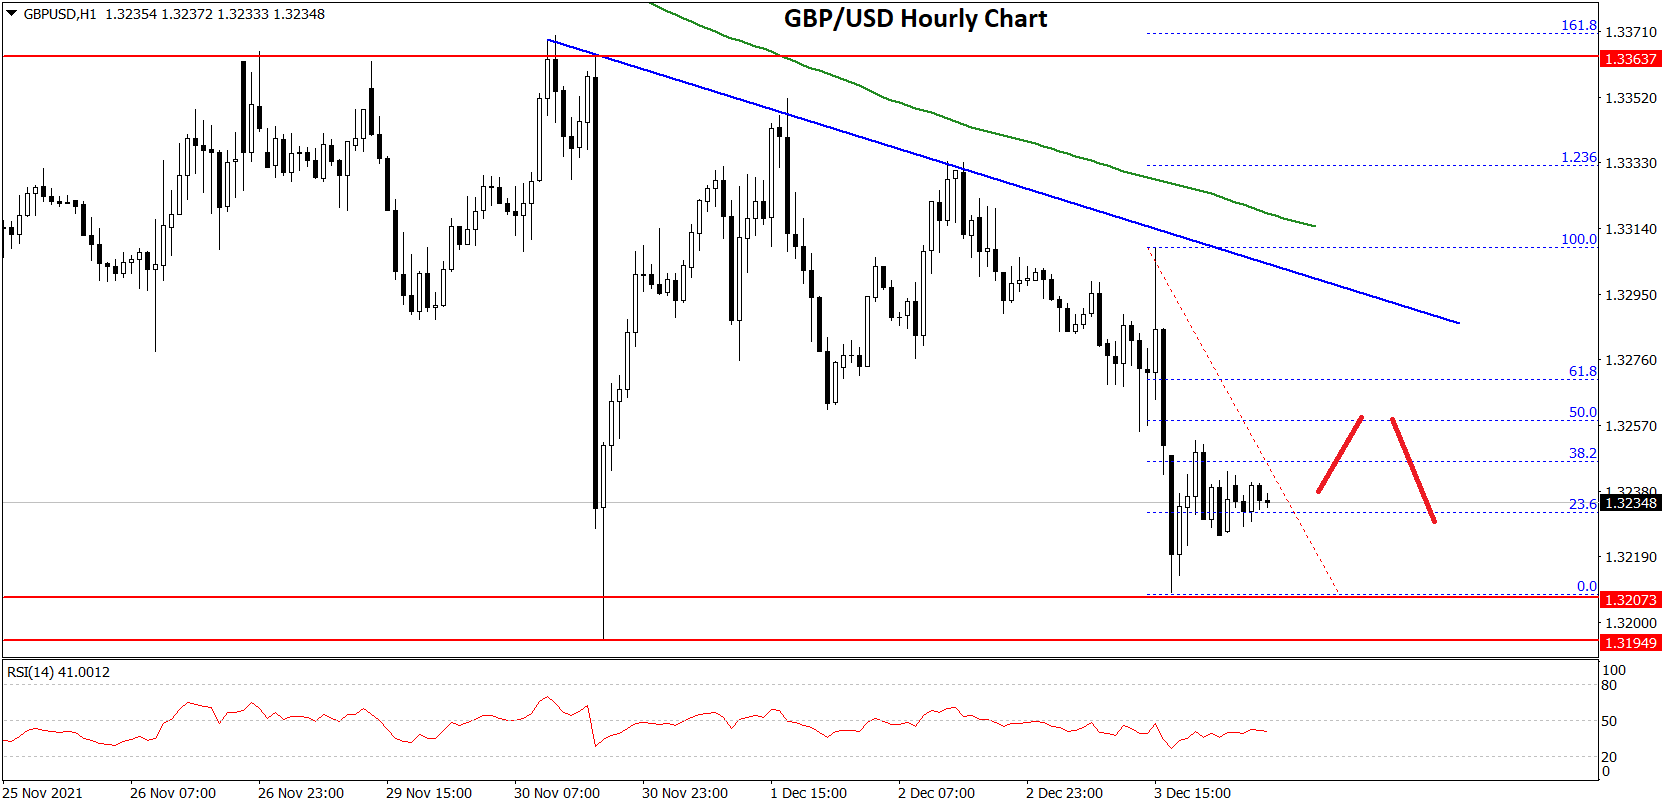
There was a break above the 23.6% Fib retracement level of the recent decline from the 1.3308 swing high to 1.3207 low.
The pair is now facing resistance near the 1.3260 level. It is close to the 50% Fib retracement level of the recent decline from the 1.3308 swing high to 1.3207 low. There is also a major bearish trend line forming with resistance near 1.3280 on the hourly chart of GBP/USD.
A close above the 1.3280 level could open the doors for more gains. The next major hurdle is near 1.3315 and the 50 hourly SMA, above which the pair could surge towards 1.3350.
On the downside, an immediate support is near the 1.3220 level. The next major support is near the 1.3200 level. If there is a break below the 1.3200 support, the pair could test the 1.3150 support. If there are additional losses, the pair could decline towards the 1.3050 level.
GBP/JPY Technical Analysis
The British Pound also started a major decline from well above 152.50 against the Japanese Yen. The GBP/JPY pair broke the 150.50 support zone to move into a bearish zone.
The pair traded even traded below the 150.00 support level and the 50 hourly simple moving average. There was also a break below the 149.50 level and traded as low as 148.99. It is now correcting losses and trading above the 149.50 level.
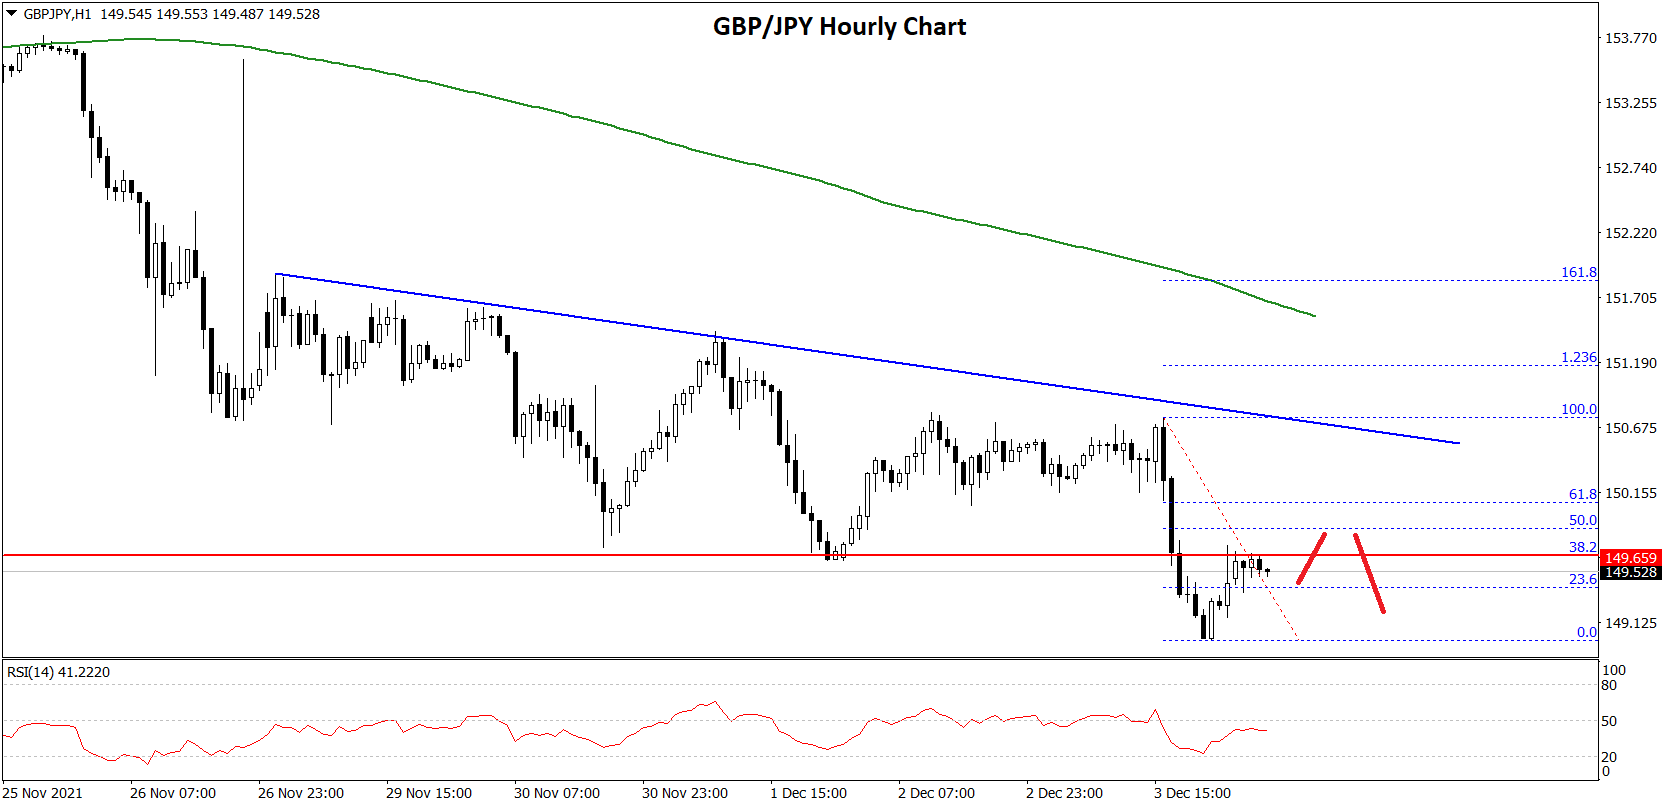
There was a break above the 23.6% Fib retracement level of the recent decline from the 150.75 swing high to 148.99 low.
On the upside, the pair is now facing resistance near the 149.65 level. The next key resistance could be 150.00. It is close to the 50% Fib retracement level of the recent decline from the 150.75 swing high to 148.99 low.
There is also a key bearish trend line forming with resistance near 150.65 on the hourly chart. A clear break above the 150.65 resistance could push the pair towards the 152.00 resistance.
On the downside, an initial support is near the 149.20 level. The next major support is near the 149.00 level. Any more downsides may possibly spark a major decline towards 148.00.
This forecast represents FXOpen Markets Limited opinion only, it should not be construed as an offer, invitation or recommendation in respect to FXOpen Markets Limited products and services or as financial advice.
Trade over 50 forex markets 24 hours a day with FXOpen. Take advantage of low commissions, deep liquidity, and spreads from 0.0 pips (additional fees may apply). Open your FXOpen account now or learn more about trading forex with FXOpen.
This article represents the opinion of the Companies operating under the FXOpen brand only. It is not to be construed as an offer, solicitation, or recommendation with respect to products and services provided by the Companies operating under the FXOpen brand, nor is it to be considered financial advice.
Stay ahead of the market!
Subscribe now to our mailing list and receive the latest market news and insights delivered directly to your inbox.


Latest articles

EUR/USD Analysis: Who Is in Control?
Two central banks, two hawkish tones — but only one dollar just took a hit. The ECB delivered a 25bp hike in June, its first since 2023, lifting the deposit rate to 2.25% as Middle East-driven energy costs pushed headline

Gold Resumes Its Advance Following the US Labour Market Report
Gold is attempting to break its medium-term trend, with the latest US labour market data acting as the main catalyst. The US employment report released on 2 July came in noticeably weaker than expected, with the pace of hiring slowing

NZD/CHF Analysis: Which Currency Breaks the Consolidation First?
NZD/CHF remains locked in a tight range as traders await the next monetary policy catalyst.
The Reserve Bank of New Zealand heads into Wednesday's meeting on shaky ground. After May's 3-3 split was resolved by a casting vote, the