


FXOpen
GBP/USD found support near 1.2800 and recovered above 1.2840. EUR/GBP is in a major uptrend and remains supported near 0.9030.
Important Takeaways for GBP/USD and EUR/GBP
- The British Pound found a decent support near 1.2800 and corrected higher towards 1.2850.
- There is a crucial bearish trend line in place with resistance at 1.2868 on the hourly chart of GBP/USD.
- EUR/GBP broke a contracting triangle and traded above the 0.9050 level.
- The pair is currently correcting lower, but it remains supported near 0.9030 and 0.9020.
GBP/USD Technical Analysis
The British Pound was under a lot of pressure recently as it struggled to hold gains above the 1.2900 level against the US Dollar. The GBP/USD pair declined and broke the 1.2880 and 1.2850 support levels.
The pair traded towards the 1.2800 support area and formed a low at 1.2799. Later, there was an upside correction and the pair climbed above the 1.2835 and 1.2840 resistance levels.

There was also a break above the 50% Fib retracement level of the last decline from the 1.2909 high to 1.2799 low. The pair spiked towards the 1.2880 resistance where sellers emerged and protected more upsides towards 1.2900.
Moreover, the pair failed to settle above the 50 hourly simple moving average and the 61.8% Fib retracement level of the last decline from the 1.2909 high to 1.2799 low. At the outset, the pair is consolidating above the 1.2835 support and is preparing for the next move.
On the upside, there is a crucial bearish trend line in place with resistance at 1.2868 on the hourly chart of GBP/USD. A break above the trend line and the 1.2880 resistance is likely to open the doors for more gains towards the 1.2900 and 1.2920 levels.
On the other hand, if the pair corrects lower, the broken resistance at 1.2835 is likely to act as a support. Moreover, there is a connecting bullish trend line in place with support at 1.2830 on the same chart. Only a break below the trend line may well push the pair back towards the 1.2800 support.
EUR/GBP Technical Analysis
The Euro remained in a major uptrend from the 0.8900 swing low against the British Pound. The EUR/GBP pair gained traction recently from the 0.8960 support level and broke many resistances.
First, there was a break and close above the 0.9000 resistance and the 50 hourly SMA. Second, there was a break above a key contracting triangle with resistance at 0.9034 on the hourly chart. The last break was above the 0.9050 level.
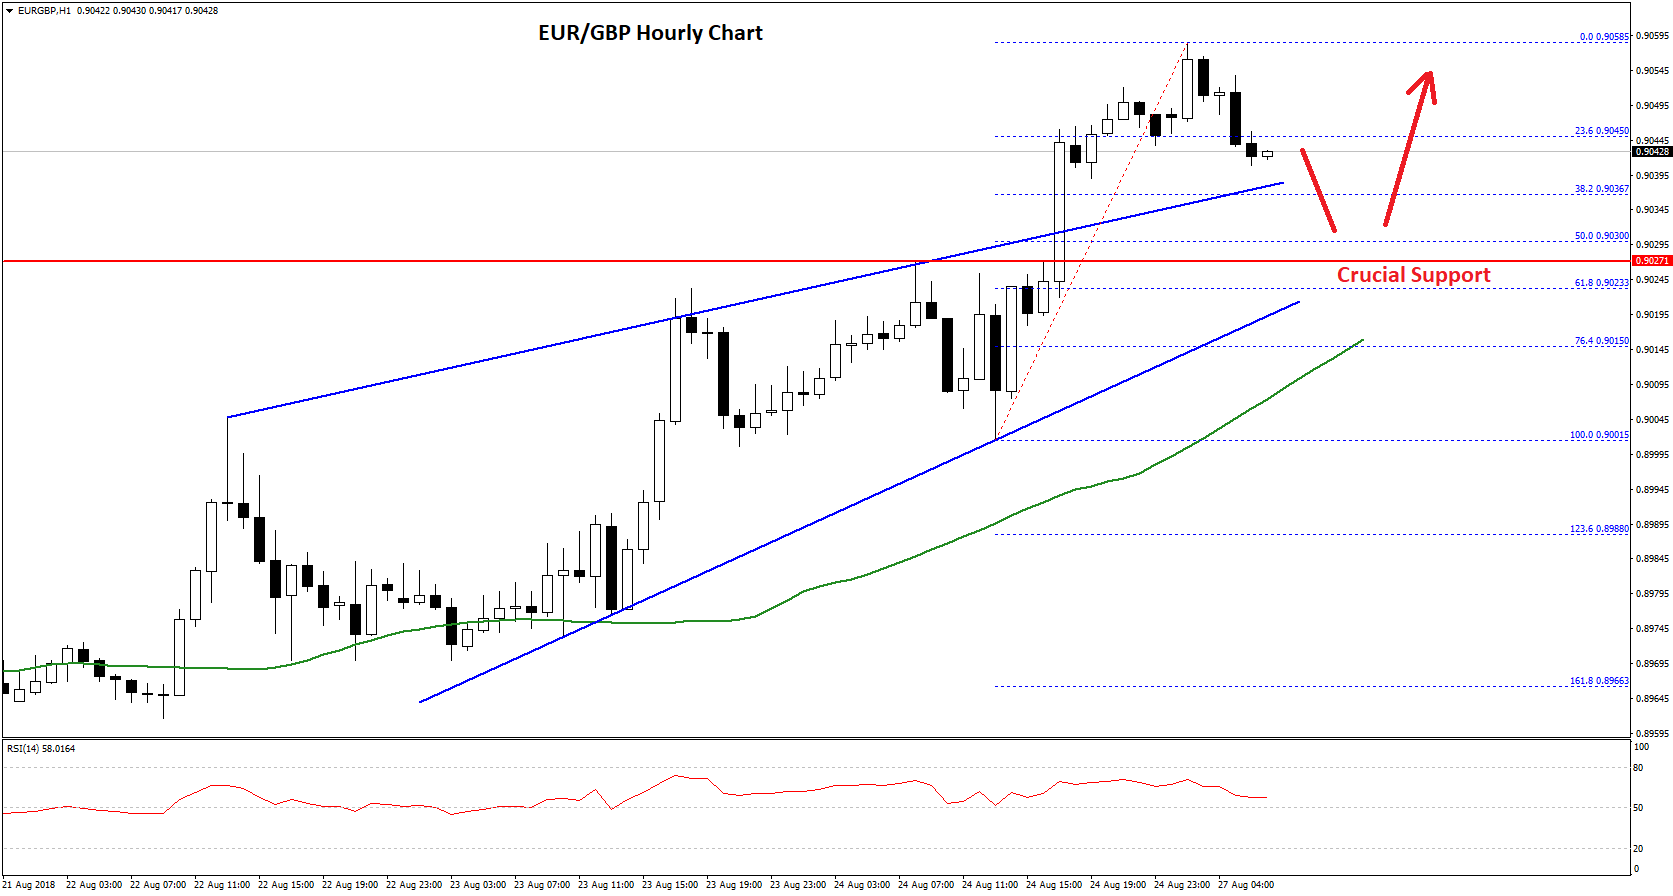
The pair traded as high as 0.9058 and it is currently correcting lower. It has moved below the 23.6% Fib retracement level of the last wave from the 0.9001 low to 0.9058 high.
However, there are many supports on the downside above the 0.9020 level. An initial support is 0.9035, which is near the broken triangle trend line. Below this, the pair may well test the 50% Fib retracement level of the last wave from the 0.9001 low to 0.9058 high at 0.9030.
Further below 0.9030, the next major support is near the 0.9020 level, a bullish trend line, and the 50 hourly SMA. Therefore, as long as the pair is above the 0.9020 and 0.9000, it remains supported for more gains.
On the upside, an initial resistance is at 0.9050, above which, the pair will most likely break the 0.9058 high for a push towards the 0.9080 level in the near term.
Trade over 50 forex markets 24 hours a day with FXOpen. Take advantage of low commissions, deep liquidity, and spreads from 0.0 pips. Open your FXOpen account now or learn more about trading forex with FXOpen.
This article represents the opinion of the Companies operating under the FXOpen brand only. It is not to be construed as an offer, solicitation, or recommendation with respect to products and services provided by the Companies operating under the FXOpen brand, nor is it to be considered financial advice.
Latest from Forex Analysis
Latest articles

Since the Start of the Week, Brent Oil Price Has Dropped over 4%
At the beginning of the week, March 15, we wrote that the price of Brent oil could form a correction from the resistance level of USD 91 per barrel. Since then, the price has decreased by more than 4% due

Fair Value Gaps vs Liquidity Voids in Trading
Understanding fair value gaps and liquidity voids is essential for traders seeking to navigate the complexities of the financial markets. These concepts, deeply rooted in the Smart Money Concept (SMC), provide valuable insights into the dynamics of supply and demand,
UK100 Share Index Rises as UK Inflation Slows
Yesterday, the UK Office for National Statistics (ONS) reported that the CPI stood at 3.2% in March. According to ForexFactory, analysts expected 3.1%, and a month ago the index was 3.4%.
Grant Fitzner, chief economist at the