


FXOpen
GBP/USD formed support near 1.2480 and later recovered, but it is facing solid hurdles near 1.2640. EUR/GBP is following a declining path and it could decline below 0.8950.
Important Takeaways for GBP/USD and EUR/GBP
- The British Pound is trading in a bearish zone below the 1.2640 and 1.2680 resistance levels.
- There is a key bearish trend line in place with resistance at 1.2640 on the hourly chart of GBP/USD.
- EUR/GBP is following a declining channel with resistance at 0.9018 on the hourly chart.
- There is a risk of more losses below the 0.8950 and 0.8940 support levels in the near term.
GBP/USD Technical Analysis
The British Pound declined this past week from the 1.2800 swing high against the US Dollar. The GBP/USD pair traded below the 1.2700 and 1.2500 support levels before buyers appeared near 1.2480.
The pair traded as low as 1.2477 on FXOpen and settled below the 50 hourly simple moving average. Later, there was a decent recovery and the price moved above the 1.2550 and 1.2600 resistance levels.
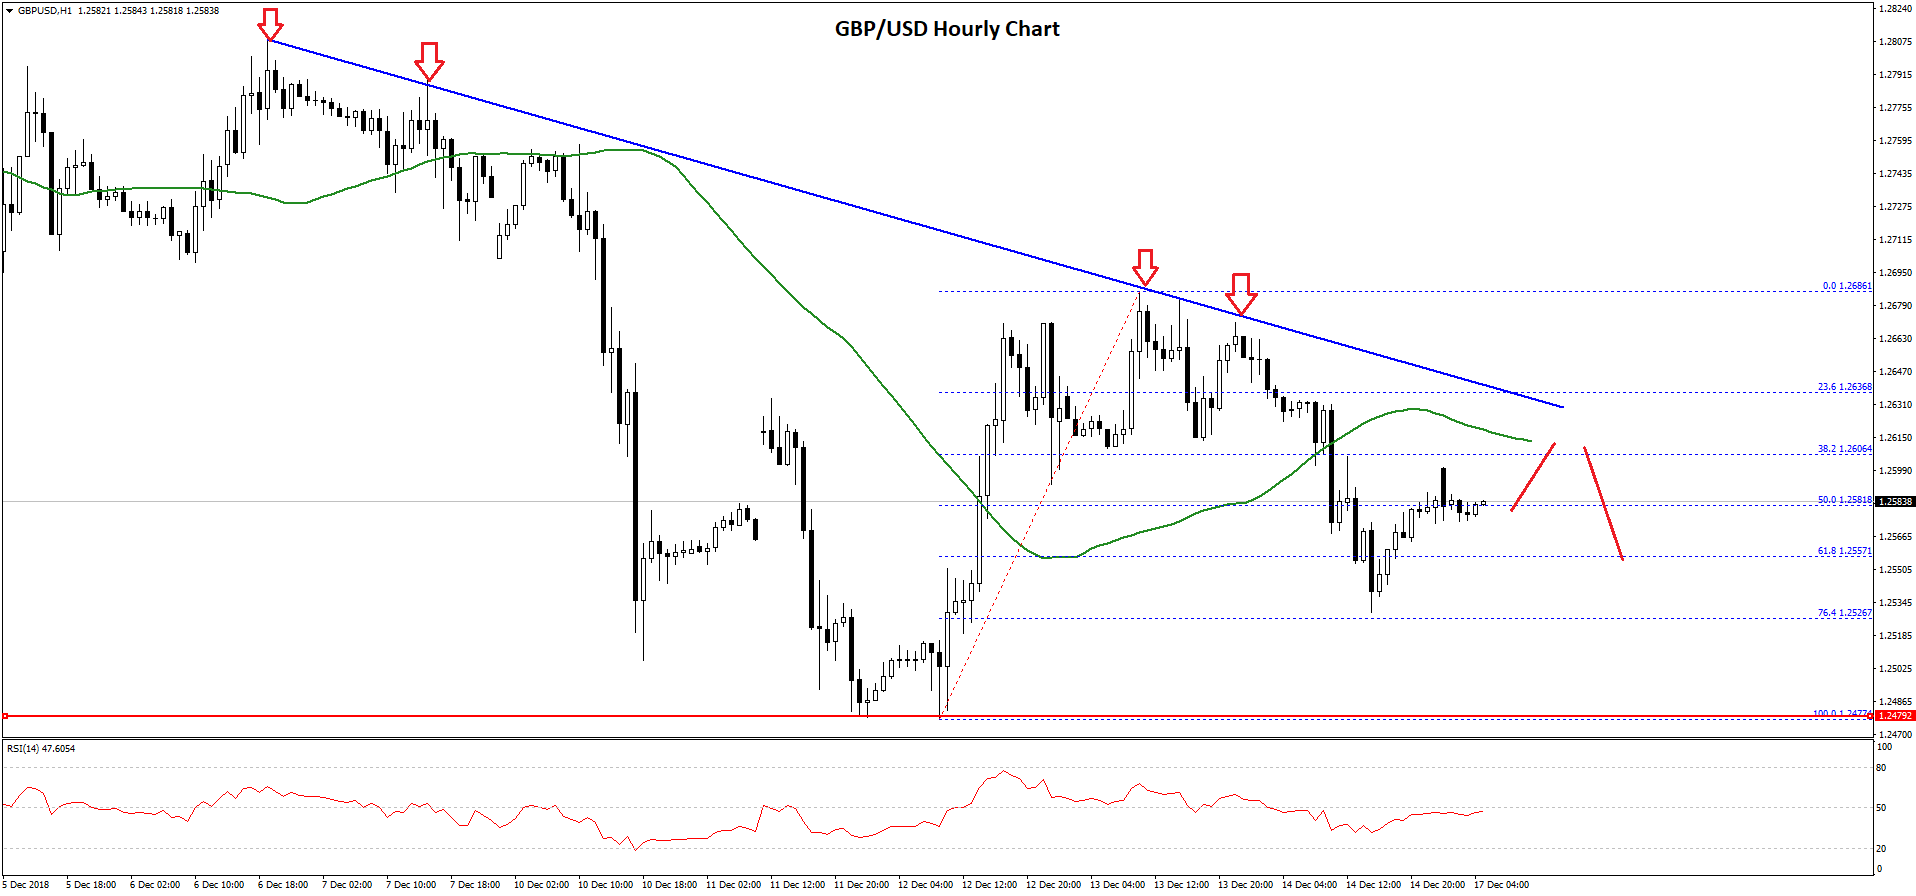
A high was formed at 1.2686 and later the price declined below the 50% Fib retracement level of the last wave from the 1.2477 low to 1.2686 high. Moreover, there was a close below the 1.2600 level and the 50 hourly simple moving average.
These are negative signs and it seems like the pair may continue to decline towards 1.2520 and the 76.4% Fib retracement level of the last wave from the 1.2477 low to 1.2686 high. Below 1.2520, the pair could even retest the 1.2480 support area.
On the upside, an initial resistance is near 1.2600 and the 50 hourly SMA. Moreover, there is a key bearish trend line in place with resistance at 1.2640 on the hourly chart of GBP/USD.
Therefore, if the pair corrects higher, it is likely to face a lot of sellers near the 1.2600 and 1.2640 resistance levels.
EUR/GBP Technical Analysis
The Euro surged higher this past week and traded above the 0.9000 and 0.9050 resistance levels against the British Pound. The EUR/GBP pair traded towards the 0.9100 resistance area and topped near the 0.9095 level.
Later, the pair corrected lower and traded below the 0.9050 support level. There was even a break below the 0.9000 support and the 50 hourly simple moving average.
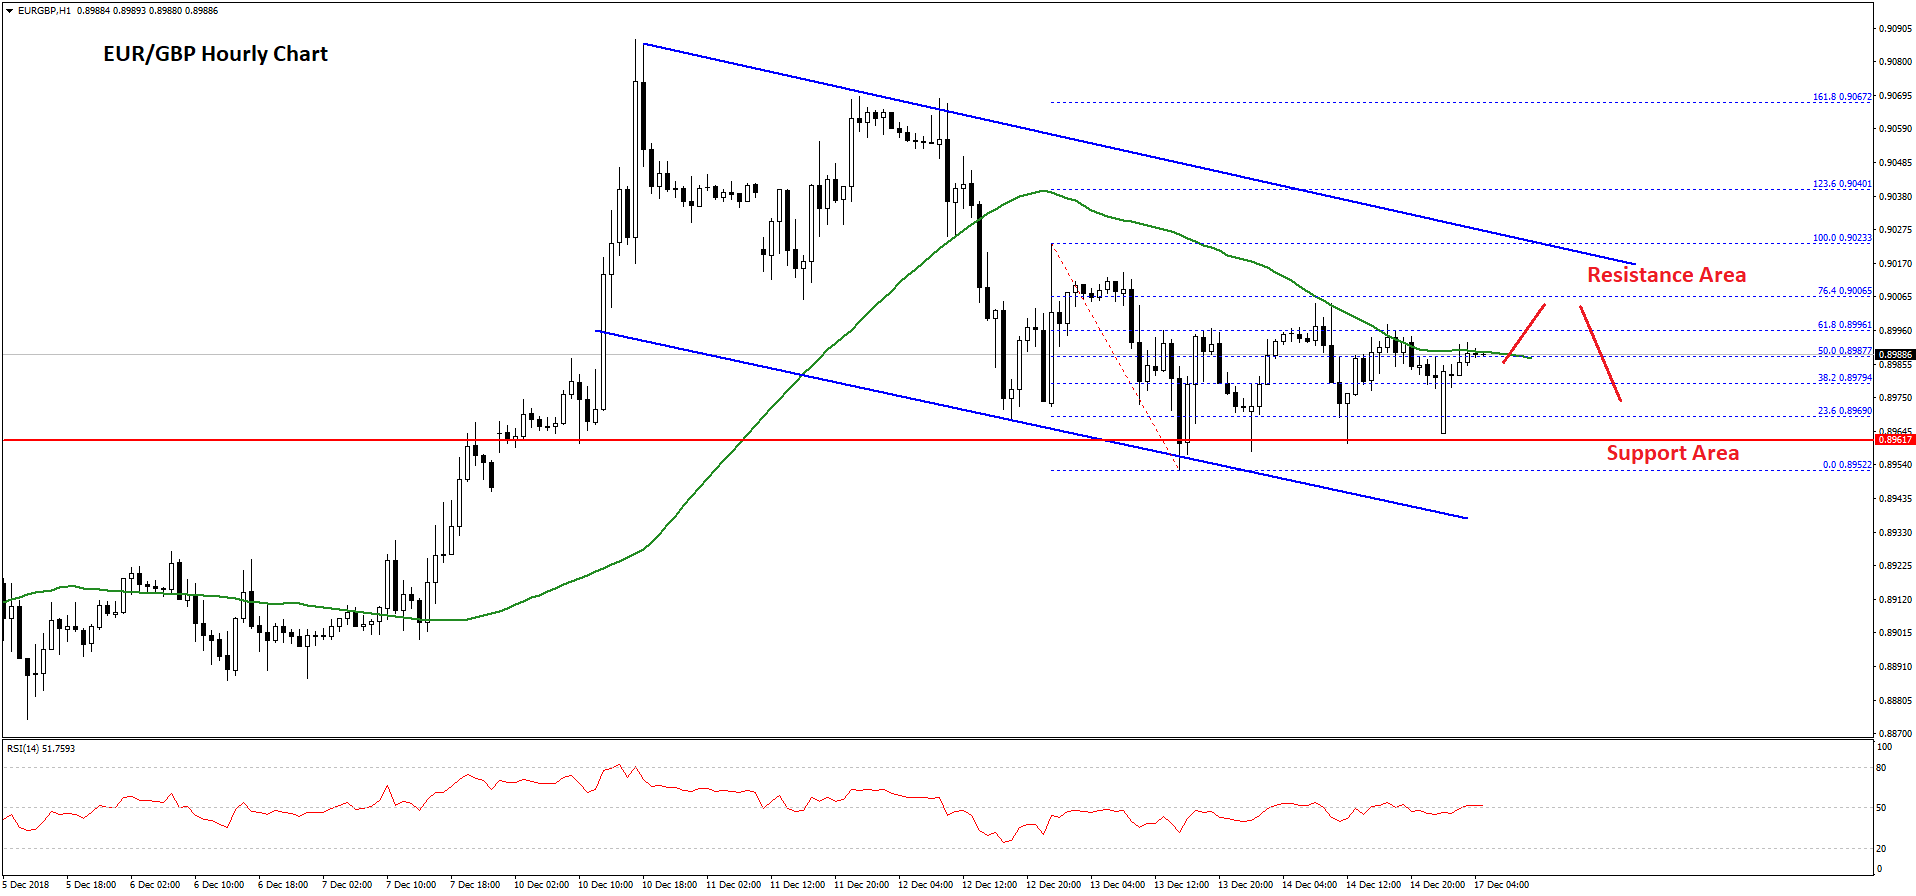
However, the 0.8950-60 area acted as a solid support and prevented declines on a few occasions. The pair is currently trading above the 50% Fib retracement level of the last decline from the 0.9023 high to 0.8952 low.
On the upside, there are many resistances near the 0.9000 and 0.9015 levels. There is also a declining channel formed with resistance at 0.9018 on the hourly chart. An intermediate resistance is the 76.4% Fib retracement level of the last decline from the 0.9023 high to 0.8952 low.
Therefore, if the pair corrects higher from the current levels, it could find sellers near the 0.9000 and 0.9015 resistance levels. Above the channel, the pair may revisit the 0.9050 and 0.9080 levels.
On the downside, the main support is at 0.8950, below which there is a risk of more losses towards the 0.8920 or 0.8900 support levels.
Trade over 50 forex markets 24 hours a day with FXOpen. Take advantage of low commissions, deep liquidity, and spreads from 0.0 pips. Open your FXOpen account now or learn more about trading forex with FXOpen.
This article represents the opinion of the Companies operating under the FXOpen brand only. It is not to be construed as an offer, solicitation, or recommendation with respect to products and services provided by the Companies operating under the FXOpen brand, nor is it to be considered financial advice.
Latest from Forex Analysis
Latest articles

Since the Start of the Week, Brent Oil Price Has Dropped over 4%
At the beginning of the week, March 15, we wrote that the price of Brent oil could form a correction from the resistance level of USD 91 per barrel. Since then, the price has decreased by more than 4% due

Fair Value Gaps vs Liquidity Voids in Trading
Understanding fair value gaps and liquidity voids is essential for traders seeking to navigate the complexities of the financial markets. These concepts, deeply rooted in the Smart Money Concept (SMC), provide valuable insights into the dynamics of supply and demand,
UK100 Share Index Rises as UK Inflation Slows
Yesterday, the UK Office for National Statistics (ONS) reported that the CPI stood at 3.2% in March. According to ForexFactory, analysts expected 3.1%, and a month ago the index was 3.4%.
Grant Fitzner, chief economist at the