


FXOpen

GBP/USD started a sharp downside correction after it rallied towards 1.2820. EUR/GBP is rising steadily and it might clear the 0.9000 resistance zone in the near term.
Important Takeaways for GBP/USD and EUR/GBP
- The British Pound is declining and trimming gains from the 1.2800 resistance level.
- There is a key bearish trend line forming with resistance near 1.2560 on the hourly chart of GBP/USD.
- EUR/GBP gained momentum and it managed to close above the 0.8950 level.
- There is a major bullish trend line forming with support near 0.8955 on the hourly chart.
GBP/USD Technical Analysis
This past week, there was a strong increase in the British Pound above the 1.2600 resistance against the US Dollar. The GBP/USD pair even broke the 1.2750 resistance zone, but it struggled to continue higher.
The pair spiked above the 1.2800 level and formed a new monthly high at 1.2813 on FXOpen. Recently, it started a sharp downside correction and traded below the 1.2750 support.
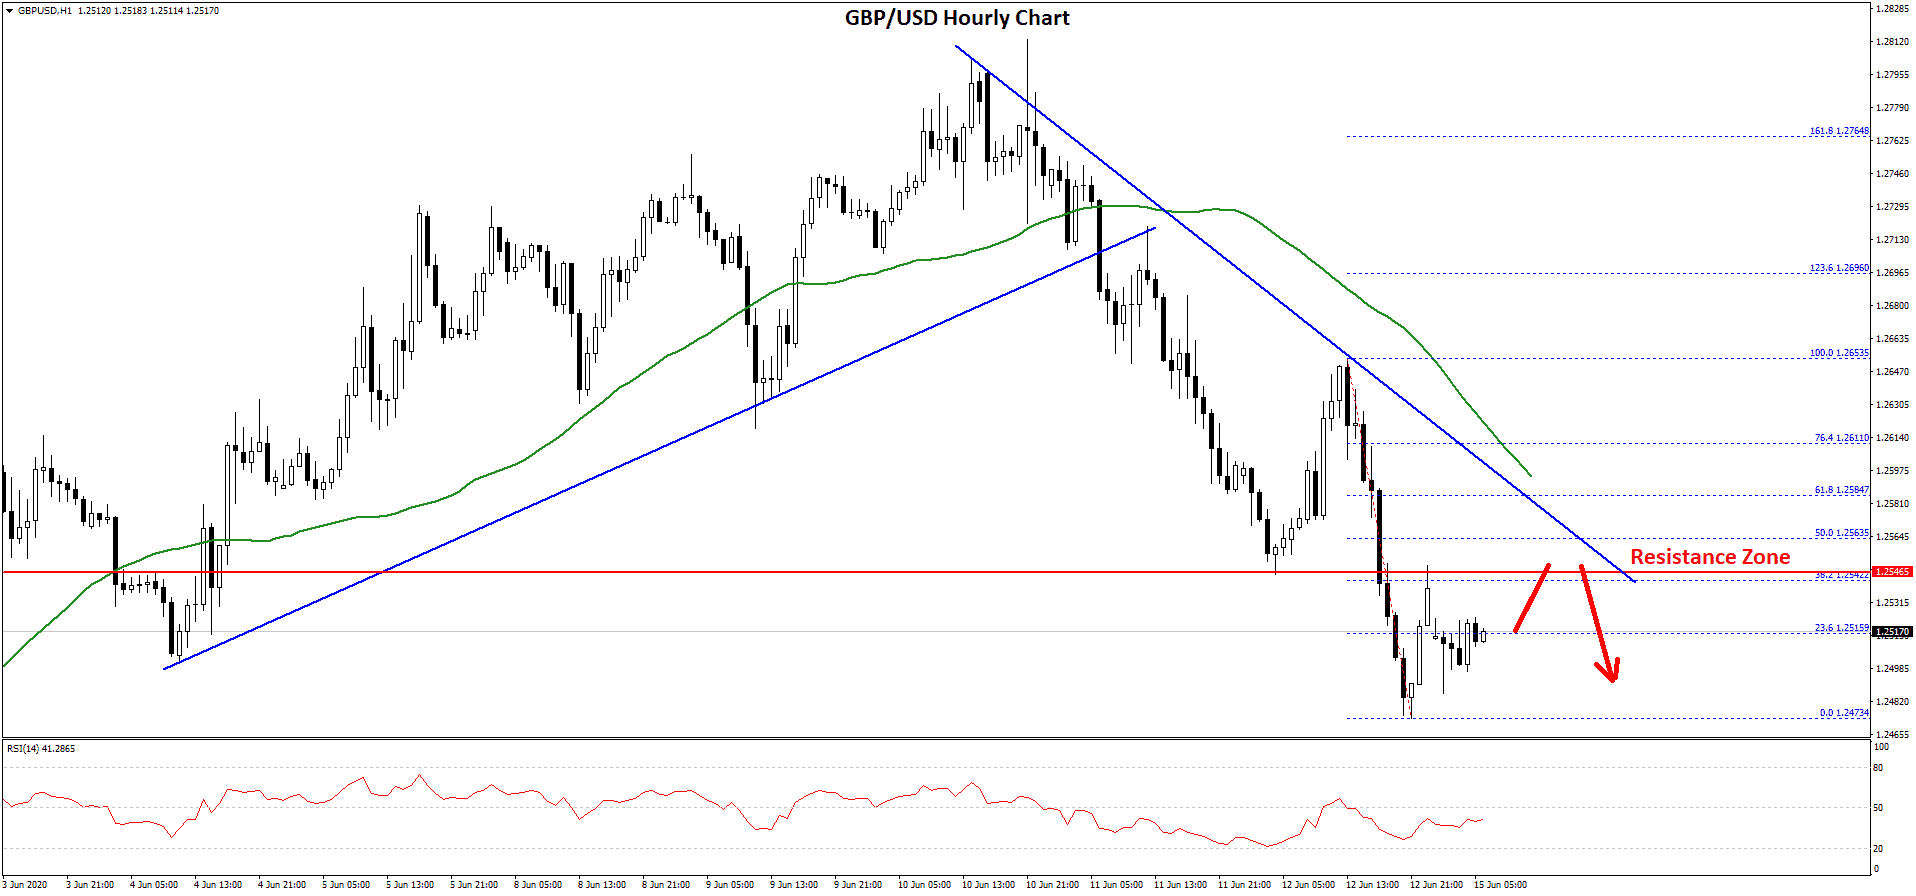
There was a clear break below the 1.2680 support level and the 50 hourly simple moving average. During the decline, there was a break below a connecting bullish trend line with support at 1.2715 on the hourly chart of GBP/USD.
Finally, the pair spiked below the 1.2500 support and traded as low as 1.2473. It is currently correcting higher above the 1.2500 level. An initial resistance is near the 1.2545 level or the 38.2% Fib retracement level of the recent decline from the 1.2653 high to 1.2473 low.
There is also a key bearish trend line forming with resistance near 1.2560 on the same chart. The trend line is close to the 50% Fib retracement level of the recent decline from the 1.2653 high to 1.2473 low.
To move into a positive zone, GBP/USD must break the 1.2550 and 1.2600 resistance levels. If not, there are chances of more losses below the 1.2500 and 1.2475 support levels in the near term. The next major support is seen near the 1.2420 level.
EUR/GBP Technical Analysis
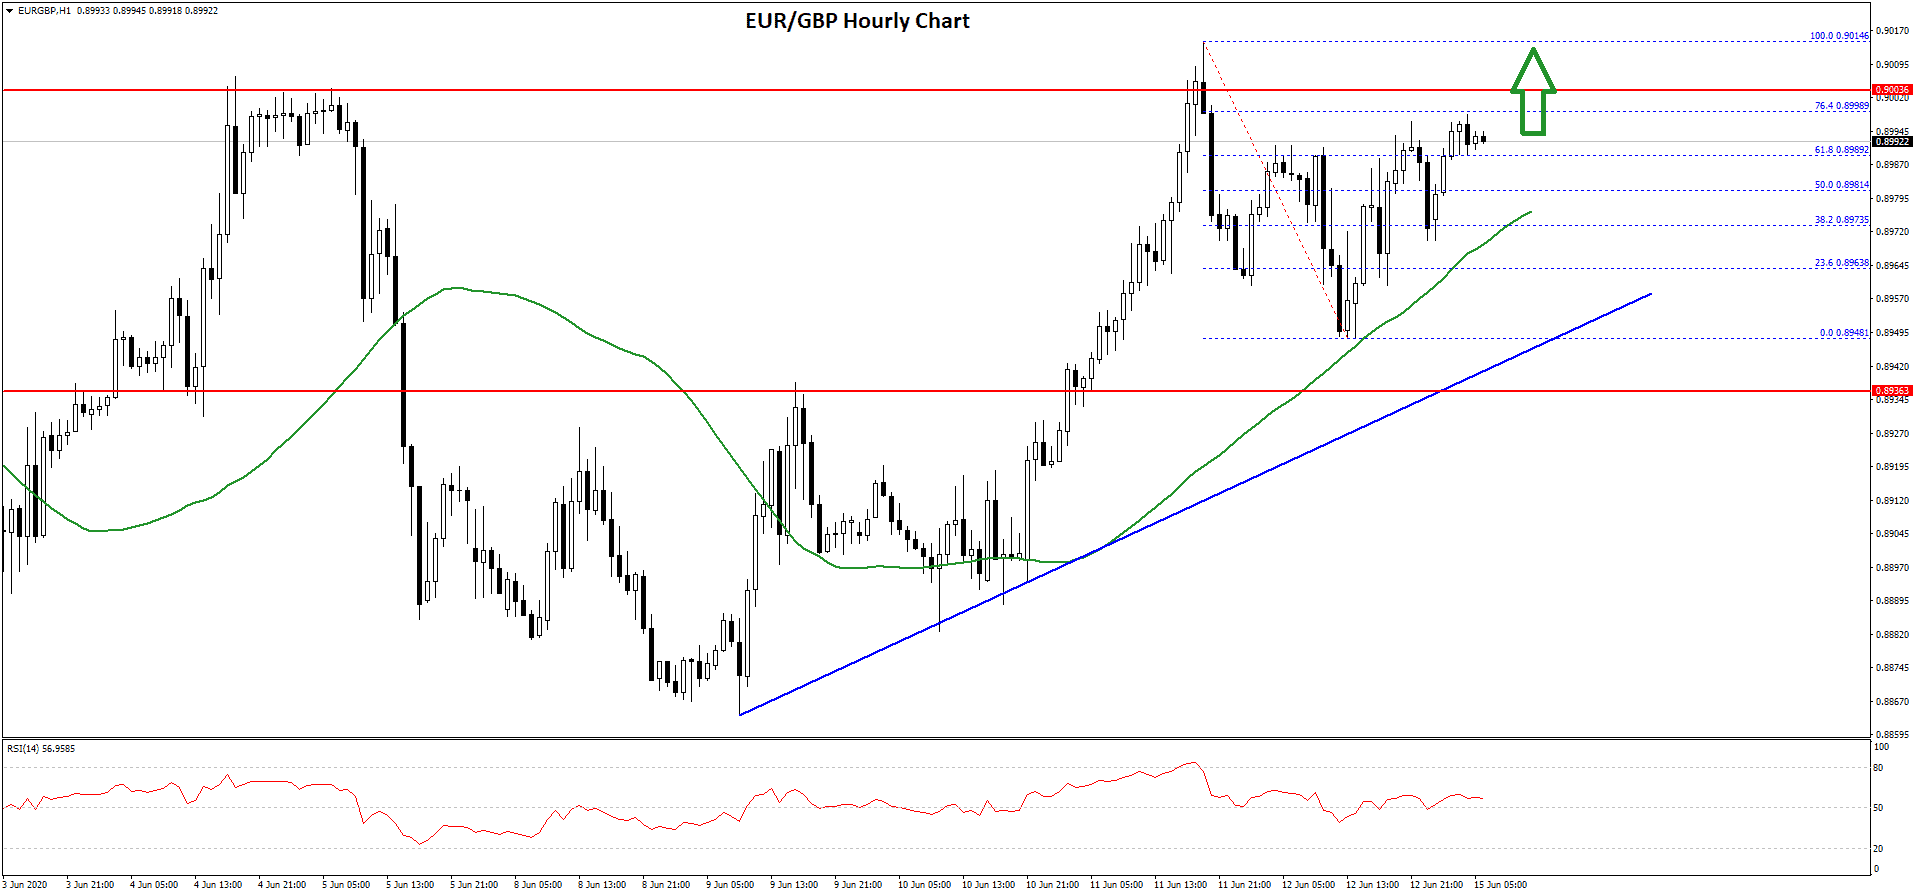
The Euro formed a decent support base near the 0.8880 level against the British Pound. As a result, the EUR/GBP pair started a steady rise above the 0.8920 resistance level.
The pair even settled above the 0.8950 level and the 50 hourly simple moving average. Finally, it spiked above the 0.9000 level and traded as high as 0.9014 before correcting lower.
 gbp
gbp
There was a downside correction below 0.8980 and the pair traded as low as 0.8948. EUR/GBP is again rising and it is trading above the 50% Fib retracement level of the recent decline from the 0.9014 high to 0.8948 low.
Besides, there is a major bullish trend line forming with support near 0.8955 on the hourly chart. It seems like the pair is trading nicely above the 0.8980 level and the 50 hourly simple moving average.
An immediate resistance is near the 0.9000 level and the 76.4% Fib retracement level of the recent decline from the 0.9014 high to 0.8948 low. A successful daily close above 0.9000 might call for more gains towards 0.9040 or 0.9065.
Conversely, the pair could start another downside correction towards the 0.8950 or 0.8925 support levels in the near term.
Trade over 50 forex markets 24 hours a day with FXOpen. Take advantage of low commissions, deep liquidity, and spreads from 0.0 pips. Open your FXOpen account now or learn more about trading forex with FXOpen.
This article represents the opinion of the Companies operating under the FXOpen brand only. It is not to be construed as an offer, solicitation, or recommendation with respect to products and services provided by the Companies operating under the FXOpen brand, nor is it to be considered financial advice.
Latest from Forex Analysis
Latest articles
AUD/USD Rises Sharply on Inflation News
The Consumer Price Index for Australia was released this morning. According to ForexFactory:
→ CPI in quarterly terms: actual = 1.0%, expected = 0.8%, previous value = 0.6%;
→ CPI in annual terms: actual = 3.5%, expected = 3.4%, previous value = 3.

TSLA Share Price Up About 13% Despite Disappointing Report
Yesterday, TSLA trading closed at USD 144.68 per share, after which Tesla reported its results for the 1st quarter:
→ earnings per share: actual = USD 0.45, forecast = USD 0.49;
→ gross income: actual = USD 21.45 billion, forecast = USD

Market Analysis: Gold Price Corrects Gains While Oil Price Regains Strength
Gold price rallied above $2,400 before correcting lower. Crude oil price is rising and it could climb further higher toward the $85.50 resistance.
Important Takeaways for Gold and Oil Prices Analysis Today
· Gold price rallied significantly above $2,