


FXOpen
GBP/USD gained traction and climbed above the 1.2500 and 1.2550 resistance levels. EUR/GBP declined below 0.8980 and it seems like it could continue to correct lower.
Important Takeaways for GBP/USD and EUR/GBP
- The British Pound is trading with a positive bias above the 1.2520 support area.
- There is a major bullish trend line forming with support near 1.2540 on the hourly chart of GBP/USD.
- EUR/GBP broke the key 0.8980 support level and it seems like the pair might even break 0.8950.
- There was a break below a major bullish trend line with support near 0.8970 on the hourly chart.
GBP/USD Technical Analysis
The British Pound formed a strong support base near the 1.2450 this past week against the US Dollar. As a result, the GBP/USD pair started a decent upward move and broke the key 1.2500 resistance level.
It gained traction above the 1.2520 pivot level and settled above the 50 hourly simple moving average. Finally, there was a break above the 1.2550 level and the pair traded close to the 1.2580 level.
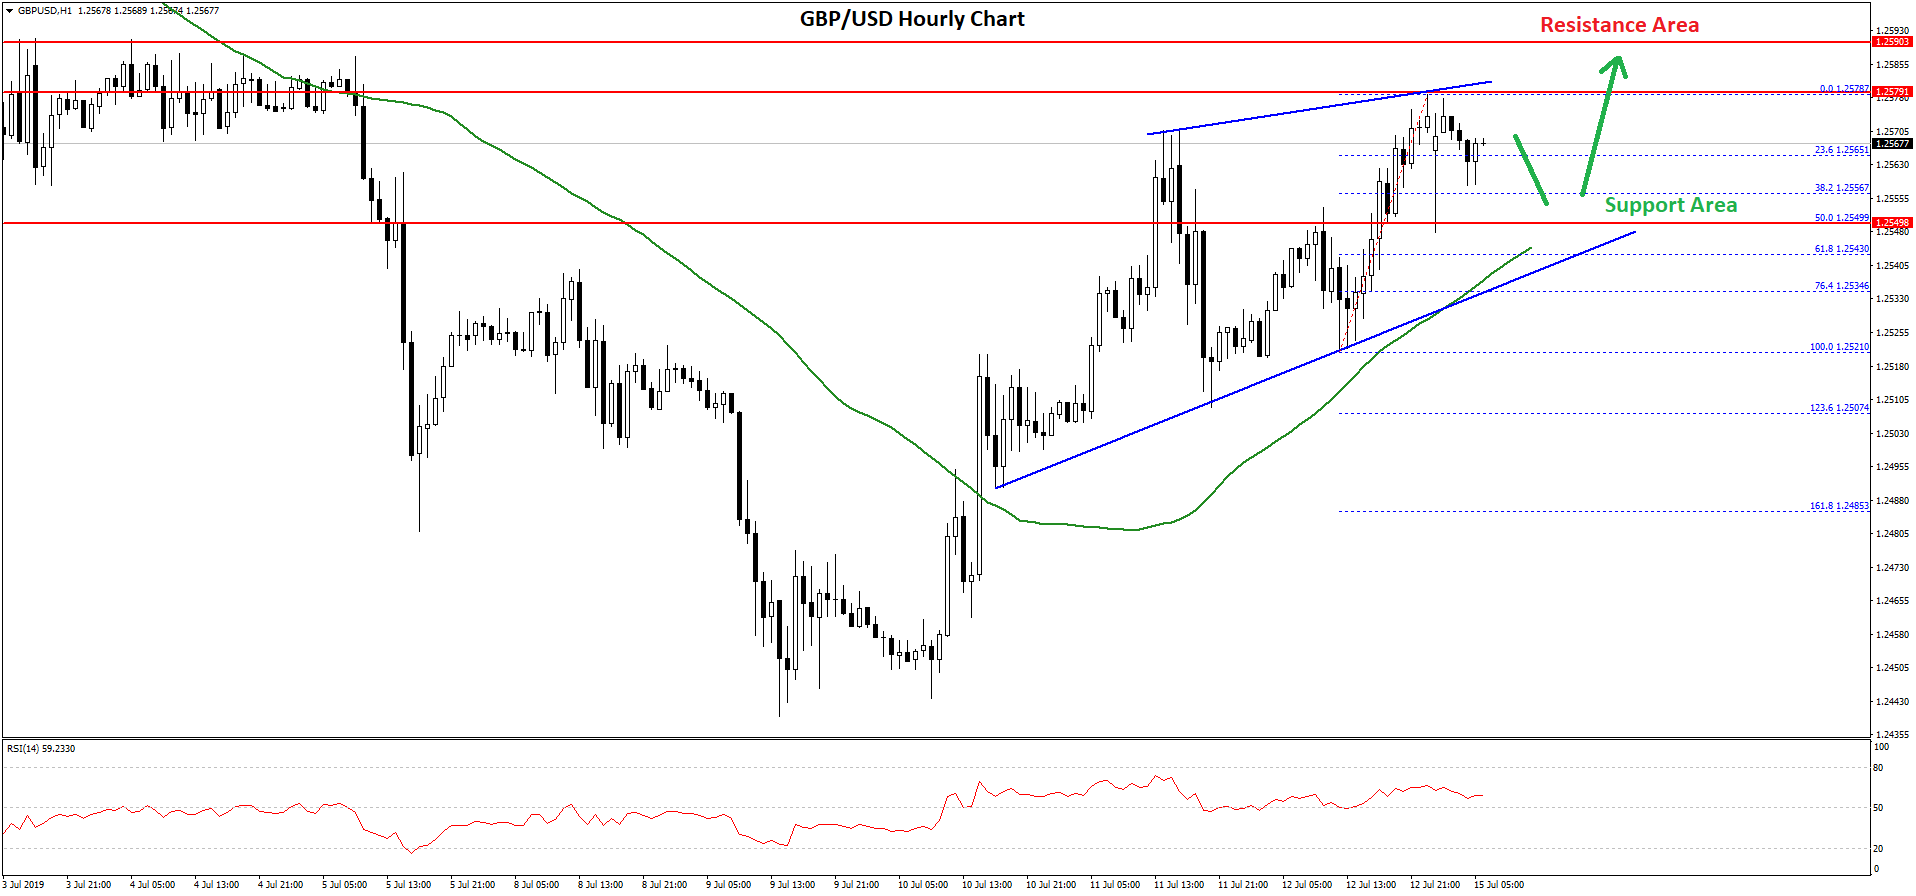
A swing high was formed near 1.2578 on FXOpen and the pair recently started a downside correction. It broke the 23.6% Fib retracement level of the last wave from the 1.2521 low to 1.2578 high.
However, losses are limited and the pair remains well supported above the 1.2550 and 1.2540 levels. There is also a major bullish trend line forming with support near 1.2540 on the hourly chart of GBP/USD.
Moreover, the 50% Fib retracement level of the last wave from the 1.2521 low to 1.2578 high is near the 1.2550 level to act as a support. If there is a downside break below the trend line, the pair could test the 1.2520 or 1.2500 support level.
On the upside, an immediate resistance is near the 1.2580 level. If there is an upside break above the 1.2580 level, the pair may even attempt to clear the main 1.2600 resistance area in the coming sessions.
EUR/GBP Technical Analysis
The Euro failed to hold gains above the 0.9000 level against the British Pound. The EUR/GBP pair topped near the 0.9010 level and recently started a downward move below the 0.9000 level.
The pair broke the 0.8980 support level and the 50 hourly simple moving average to enter a bearish zone. During the decline, there was a break below a major bullish trend line with support near 0.8970 on the hourly chart.
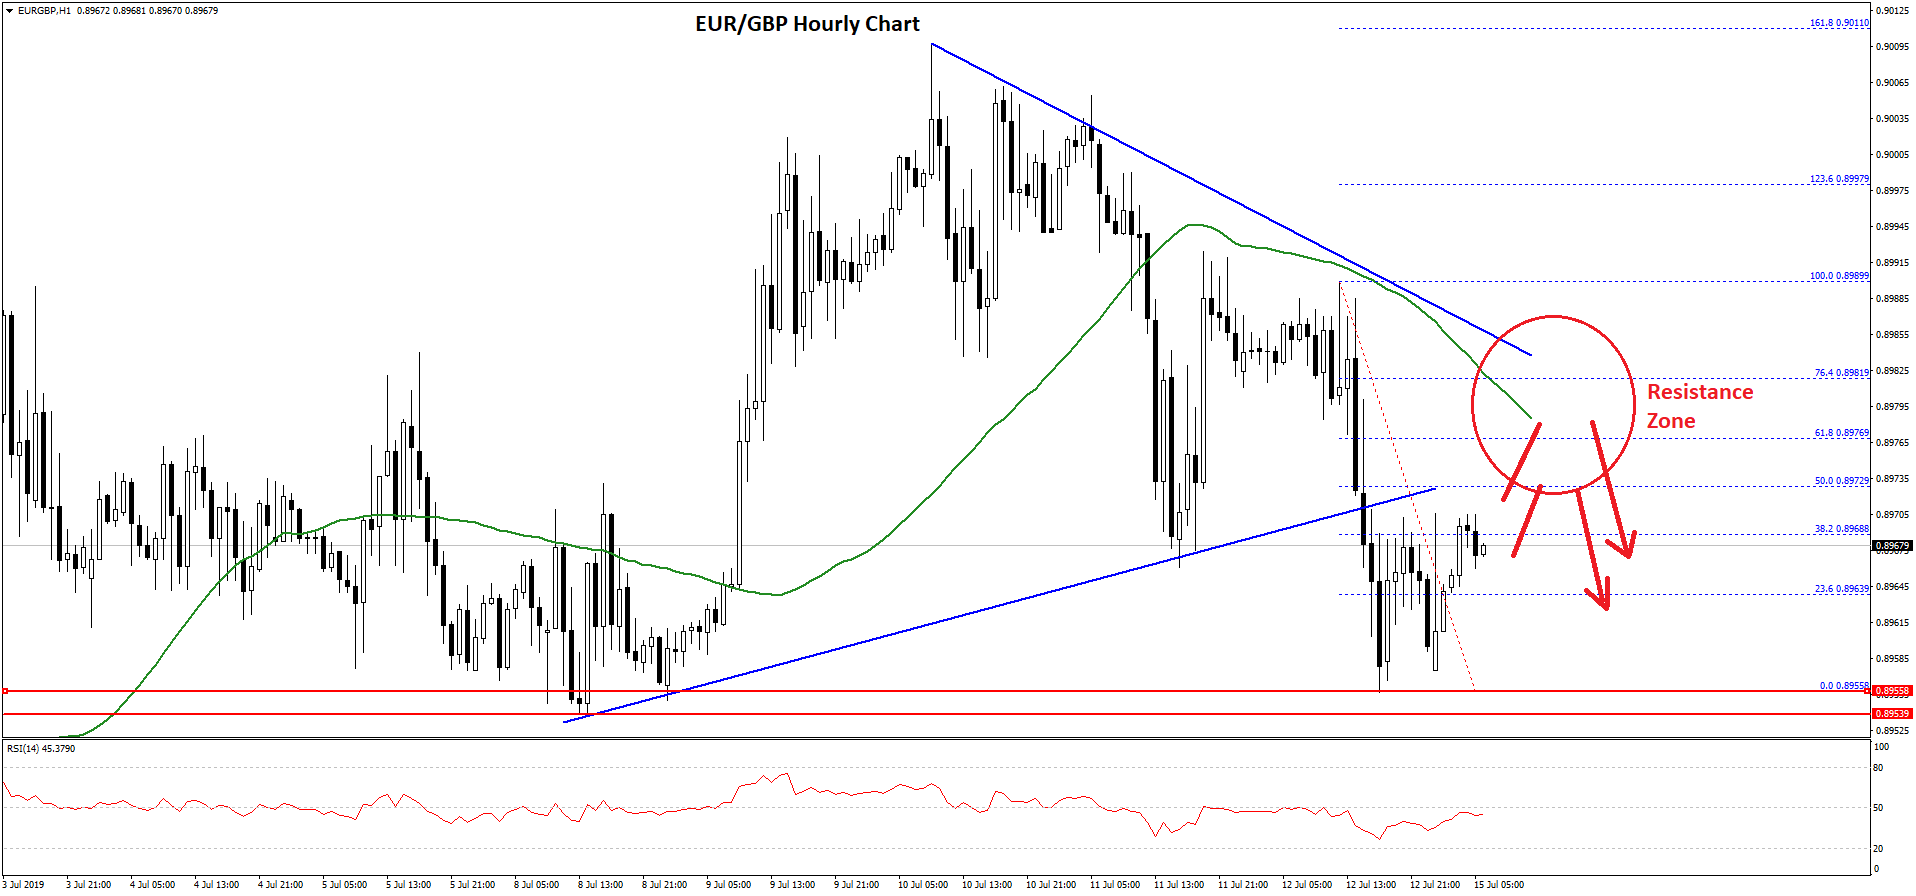
The pair traded close to the 0.8950 level and a swing low was formed at 0.8955. The pair is currently correcting higher above the 23.6% Fib retracement level of the last decline from the 0.8989 high to 0.8955 low.
On the upside, there is a strong resistance forming near the 0.8980 level and the 50 hourly simple moving average. An immediate resistance is near 0.8972 plus the 50% Fib retracement level of the last decline from the 0.8989 high to 0.8955 low.
However, the main resistance is near the 0.8980 level, above which the pair could move back above the 0.9000 resistance area in the near term.
Conversely, if EUR/GBP fails to climb above 0.8972 or 0.8980, it could resume its decline. On the downside, the main support is near the 0.8950 level, below which the pair could test the 0.8920 support.
Trade over 50 forex markets 24 hours a day with FXOpen. Take advantage of low commissions, deep liquidity, and spreads from 0.0 pips. Open your FXOpen account now or learn more about trading forex with FXOpen.
This article represents the opinion of the Companies operating under the FXOpen brand only. It is not to be construed as an offer, solicitation, or recommendation with respect to products and services provided by the Companies operating under the FXOpen brand, nor is it to be considered financial advice.
Latest from Forex Analysis
Latest articles

Google Share Price Rose Post-market to a New All-time Record
Yesterday, after the close of the main trading session, a report on activities for the 1st quarter of Alphabet Inc. (Google's parent company) was published. The report was strong, exceeding investors' expectations.
→ Quarterly EPS = USD 1.89 (expected = USD 1.

S&P 500 Rebounds after Negative GDP News
Data released yesterday showed US GDP growth slowed to 1.6% in the first quarter of the year. According to ForexFactory: forecast = 2.2%, past value = 2.4%.
Reaction to the news sent the S&P 500 mini stock

GBP/USD And USD/CAD Daily Chart Outlook
GBP/USD is attempting a recovery wave from 1.2300. USD/CAD is consolidating and might aim for a move above the 1.3760 resistance zone.
Important Takeaways for GBP/USD and USD/CAD Analysis Today
· The British Pound started