


FXOpen
EUR/USD remained under a lot of selling pressure recently and declined below the 1.1820 support area. On the other hand, USD/JPY surged higher before facing a key resistance near 111.40.
Important Takeaways for EUR/USD and USD/JPY
- The Euro is currently consolidating above the 1.1700/20 support area.
- There is a crucial resistance zone formed around the 1.1820 level.
- USD/JPY has started a downside correction and it recently broke a major bullish trend line with support at 110.90 on the hourly chart.
- Euro Zone’s Manufacturing and Services PMI (Preliminary) for May 2018 will be released today, which could impact EUR/USD in the short term.
EUR/USD Technical Analysis
The Euro declined heavily during the past few days and broke many supports such as 1.1880, 1.1850 and 1.1820 against the US Dollar. The EUR/USD pair even settled below 1.1800, and it is currently consolidating losses above the 1.1720 level.
The pair recently corrected higher, but the broken support near 1.1820 acted as a strong barrier for buyers. It declined back below 1.1800, broke a bullish trend line on the hourly chart at 1.1780, and even settled below the 50 hourly simple moving average.
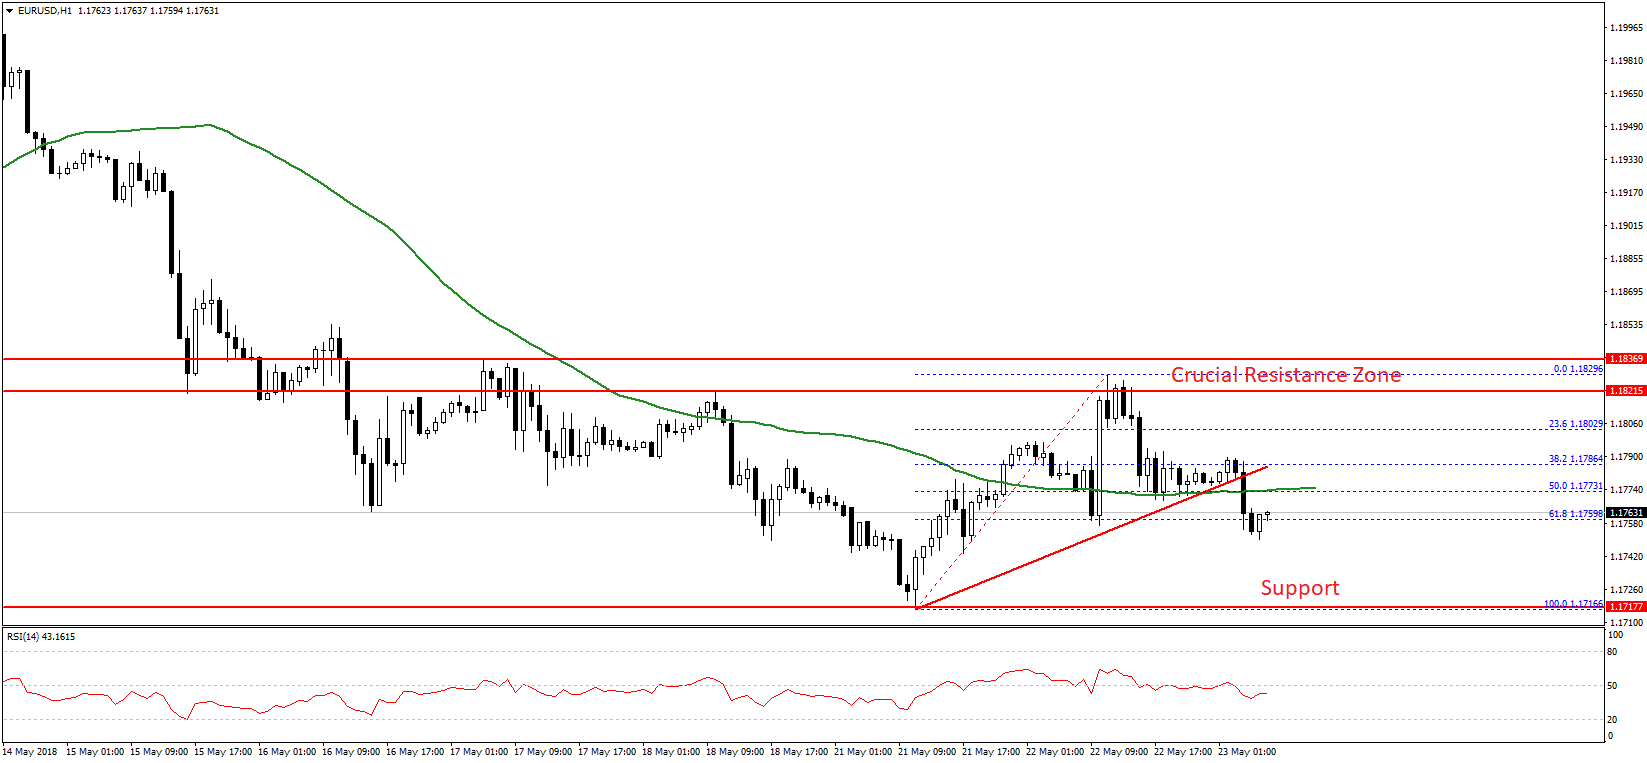
More importantly, it broke the 50% Fib retracement level of the last wave from the 1.1716 low to 1.1829 high. Therefore, there are chances of more losses below 1.1750 in the near term.
It seems like the pair is forming a range pattern with support above 1.1720 and resistance at 1.1820. Going forward, there could be ranging moves and consolidation before the pair makes the next move.
A successful break and close above 1.1820 may perhaps open the doors for a larger correction towards 1.1900. On the flip side, a downside break below 1.1720 might call for more losses below 1.1680.
Today, there are many key releases lined up in the Euro Zone such as preliminary readings of Manufacturing and Services PMI in May 2018. The market is looking for positive signs, and if the outcome is stable or above the forecast, EUR/USD could move higher towards 1.1800 and 1.1820.
USD/JPY Technical Analysis
The US Dollar remained in a major uptrend and traded above 111.00 against the Japanese Yen. However, the USD/JPY pair faced a strong selling interest near 111.40. A high was formed at 111.37 before the pair started a downside correction.
During the decline, there was a break below a major bullish trend line with support at 110.90 on the hourly chart. The pair also settled below the 110.80 support and the 50 hourly simple moving average.
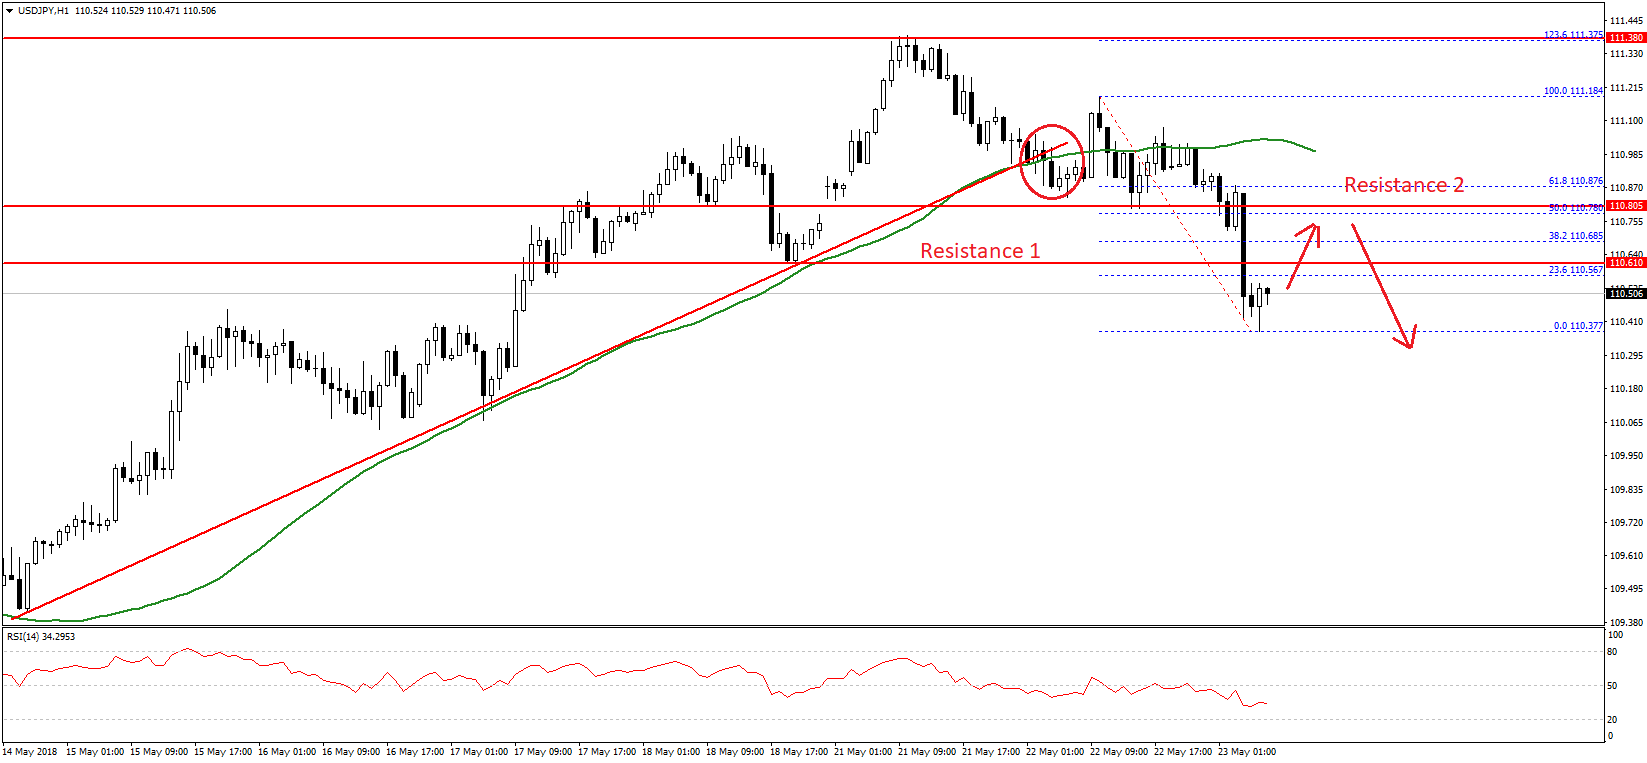
It traded as low as 110.37 and is currently correcting higher. An initial resistance is near the 23.6% Fib retracement level of the last drop from the 111.37 high to 110.37 low. However, the most important resistance for buyers is near 110.80, which was a support earlier.
The mentioned 110.80 resistance is also close to the 50% Fib retracement level of the last drop from the 111.37 high to 110.37 low. Therefore, if the pair moves higher, it could face hurdles near 110.80 and 110.85.
Overall, it seems like USD/JPY has started a major downside correction and it could decline further towards 110.00 or 109.50 in the near term.
Trade over 50 forex markets 24 hours a day with FXOpen. Take advantage of low commissions, deep liquidity, and spreads from 0.0 pips. Open your FXOpen account now or learn more about trading forex with FXOpen.
This article represents the opinion of the Companies operating under the FXOpen brand only. It is not to be construed as an offer, solicitation, or recommendation with respect to products and services provided by the Companies operating under the FXOpen brand, nor is it to be considered financial advice.
Latest from Forex Analysis
Latest articles

Weekly Market Wrap With Gary Thomson: UK100, USD, GOLD, OIL
Get the latest scoop on the week's hottest headlines, all in one convenient video. Join Gary Thomson, the COO of FXOpen UK, as he breaks down the most significant news reports and shares his expert insights.
- UK100 Share Index Rises

What Is a Darvas Box Theory and How Does It Work in Trading?
The Darvas Box Theory, pioneered by Nicolas Darvas in the 1950s, has transcended its stock market origins to become a valuable tool for forex traders. This method leverages specific price movements and patterns, known as the Darvas Box, to track

NFLX Stock Price Falls Despite Subscriber Growth
Yesterday, after the close of the main trading session on the stock market, Netflix reported to investors for the 1st quarter of 2024.
The report turned out better than expected:
→ earnings per share: actual = USD 5.28, forecast = USD 4.