


FXOpen
EUR/USD started a major downward move and declined below 1.1600. Similarly, there was an increase in selling pressure on USD/JPY, resulting in losses towards 108.00.
Important Takeaways for EUR/USD and USD/JPY
- The Euro declined heavily recently and settled below the 1.1650 support area.
- The EUR/USD pair remains at a risk of more declines towards the 1.1440 level.
- USD/JPY is in a bearish zone and is following a major bearish trend line with resistance at 108.95 on the hourly chart.
- Japan’s Retail Trade in April 2018 increased 1.6% (YoY), better than the forecast of +1.0%.
EUR/USD Technical Analysis
The Euro remained in a downtrend from well above the 1.1800 level against the US Dollar. The EUR/USD pair declined steadily during the past few days and broke many supports such as 1.1750, 1.1700, 1.1650 and 1.1600.
The pair even settled below the 50 hourly simple moving average and it recently traded close to the 1.1500 level. A low was formed at 1.1509 before the pair started an upside correction. It moved above the 1.1550 resistance and the 50% Fib retracement level of the last decline from the 1.1639 high to 1.1509 low.
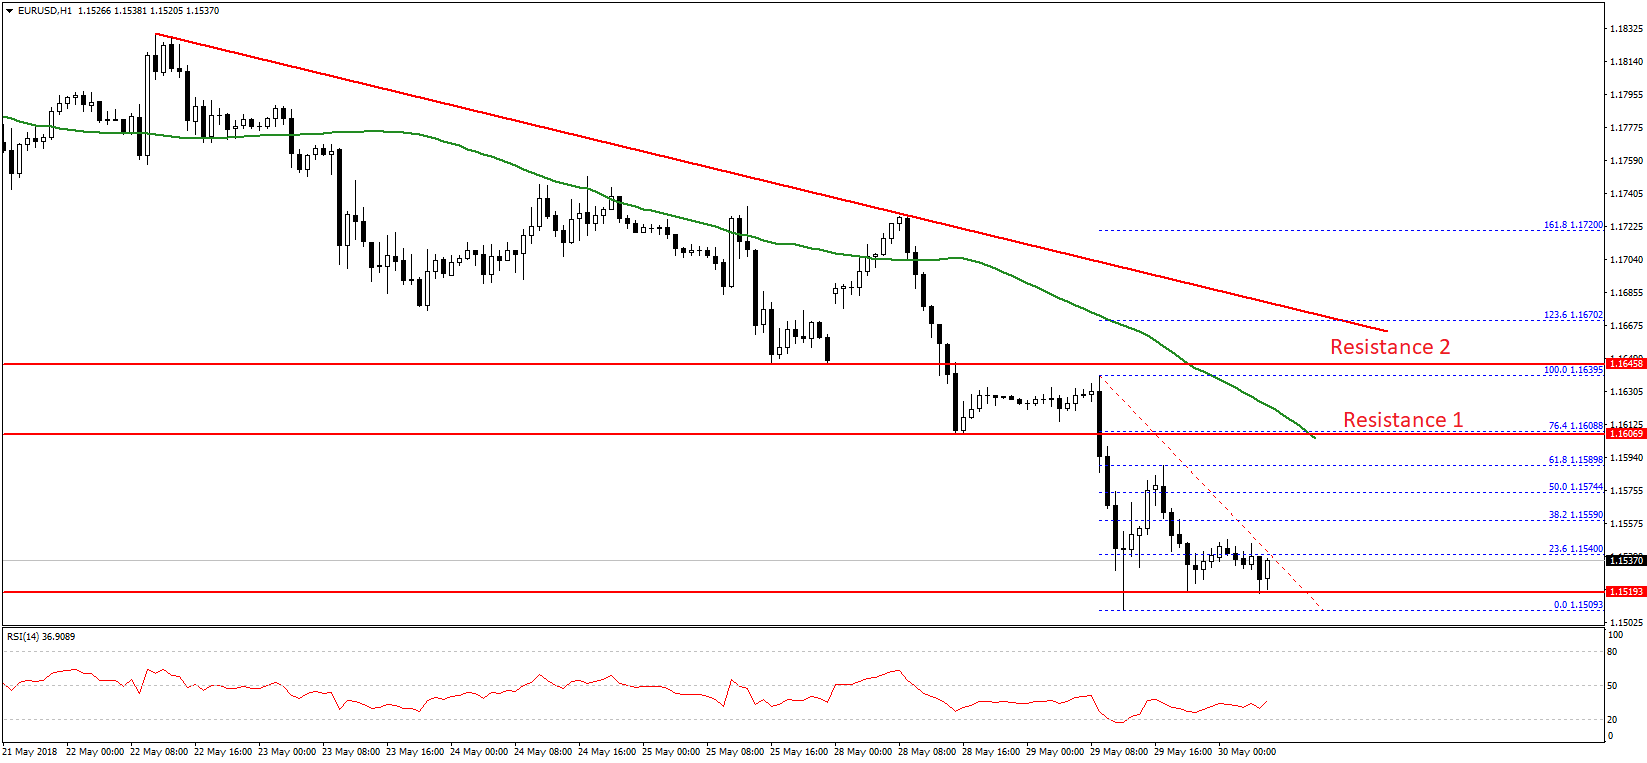
However, the upside move was capped by the 1.1590 level and the 61.8% Fib retracement level of the last decline from the 1.1639 high to 1.1509 low.
Looking at the chart, it seems like there are two resistances on the upside near 1.1600 and the 50 hourly SMA. As long as the pair is below 1.1600, it remains at a risk of more losses. On the downside, the 1.1500-1.1510 zone is an important support. Should the pair break this, there could be heavy declines towards 1.1440.
Today, there are a few releases lined up in the Euro Zone, including the German Retail Sales report and CPI figures for May 2018 (Preliminary). Moreover, May’s Consumer Confidence index will be released for the Euro Area, which is forecasted to remain at 0.2.
USD/JPY Technical Analysis
The US Dollar was under pressure recently and declined below 109.50 against the Japanese Yen. The USD/JPY pair moved down, broke the 109.00 support area and settled below the 50 hourly simple moving average.
There was even a break below the 108.50 support and the pair traded as low as 108.13. Later, the pair started an upside correction and traded above the 23.6% Fib retracement level of the last decline from the 109.82 high to 108.13 low.
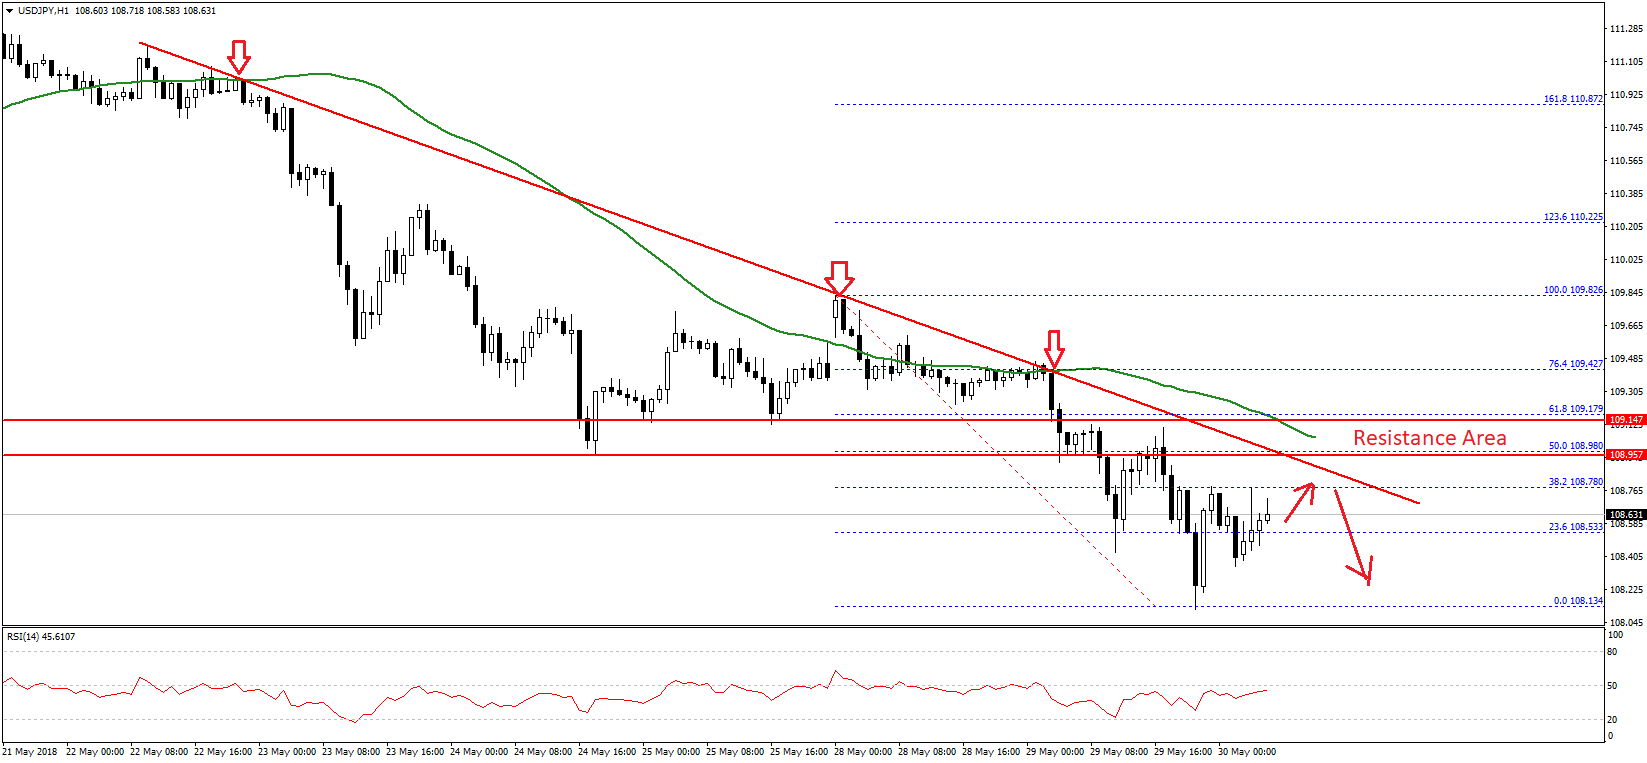
However, there are many barriers on the upside near the 108.80 level. There is also a major bearish trend line with resistance at 108.95 on the hourly chart. Around the trend line, the 50% Fib retracement level of the last decline from the 109.82 high to 108.13 low is at 108.98.
More importantly, the 50 hourly SMA is positioned near 109.00. Therefore, it won’t be easy for buyers to break the 108.80-109.00 zone in the near term. On the downside, the 108.20 level is a decent support, followed by the 108.00 handle.
Today in Japan, the Retail Trade report for April 2018 was released by the Ministry of Economy, Trade and Industry. The market was looking for a rise of 1% in the retail trade compared with the same month a year ago in April 2018.
However, the result was positive as there was an increase of 1.6% (YoY) in Japan’s Retail Trade. In terms of the monthly change, Japan’s Retail Trade increase 1.4%, much better than the last decline of 0.7%.
Trade over 50 forex markets 24 hours a day with FXOpen. Take advantage of low commissions, deep liquidity, and spreads from 0.0 pips. Open your FXOpen account now or learn more about trading forex with FXOpen.
This article represents the opinion of the Companies operating under the FXOpen brand only. It is not to be construed as an offer, solicitation, or recommendation with respect to products and services provided by the Companies operating under the FXOpen brand, nor is it to be considered financial advice.
Latest from Forex Analysis
Latest articles

Market Analysis: AUD/USD and NZD/USD Turn Red
AUD/USD declined below the 0.6500 and 0.6455 support levels. NZD/USD is also moving lower and might struggle to recover above 0.5950.
Important Takeaways for AUD/USD and NZD/USD Analysis Today
· The Aussie Dollar started

Since the Start of the Week, Brent Oil Price Has Dropped over 4%
At the beginning of the week, March 15, we wrote that the price of Brent oil could form a correction from the resistance level of USD 91 per barrel. Since then, the price has decreased by more than 4% due

Fair Value Gaps vs Liquidity Voids in Trading
Understanding fair value gaps and liquidity voids is essential for traders seeking to navigate the complexities of the financial markets. These concepts, deeply rooted in the Smart Money Concept (SMC), provide valuable insights into the dynamics of supply and demand,