


FXOpen
The Euro and British Pound managed to form a support base for an upward move against the Japanese Yen. Both EUR/JPY and GBP/JPY broke key resistances to move into a bullish zone.
Important Takeaways for EUR/JPY and GBP/JPY
- The Euro surged higher recently and broke the 128.50 resistance against the Japanese Yen.
- There was a break above a significant bearish trend line at 127.85 on the hourly chart of EUR/JPY.
- GBP/JPY also broke a key resistance at 144.75 to gain upside momentum.
- According to a report, European Union leaders got a breakthrough deal related to migration and overcame Italian demands.
EUR/JPY Technical Analysis
The Euro formed a decent support base near the 127.15 level against the Japanese Yen. The EUR/JPY pair started an upward wave and broke a few important resistance levels such as 127.50 and 128.00.
There was a sharp spike in the Euro after European Union leaders got a breakthrough deal. Both EUR/USD and EUR/JPY climbed sharply and moved into a bullish zone.
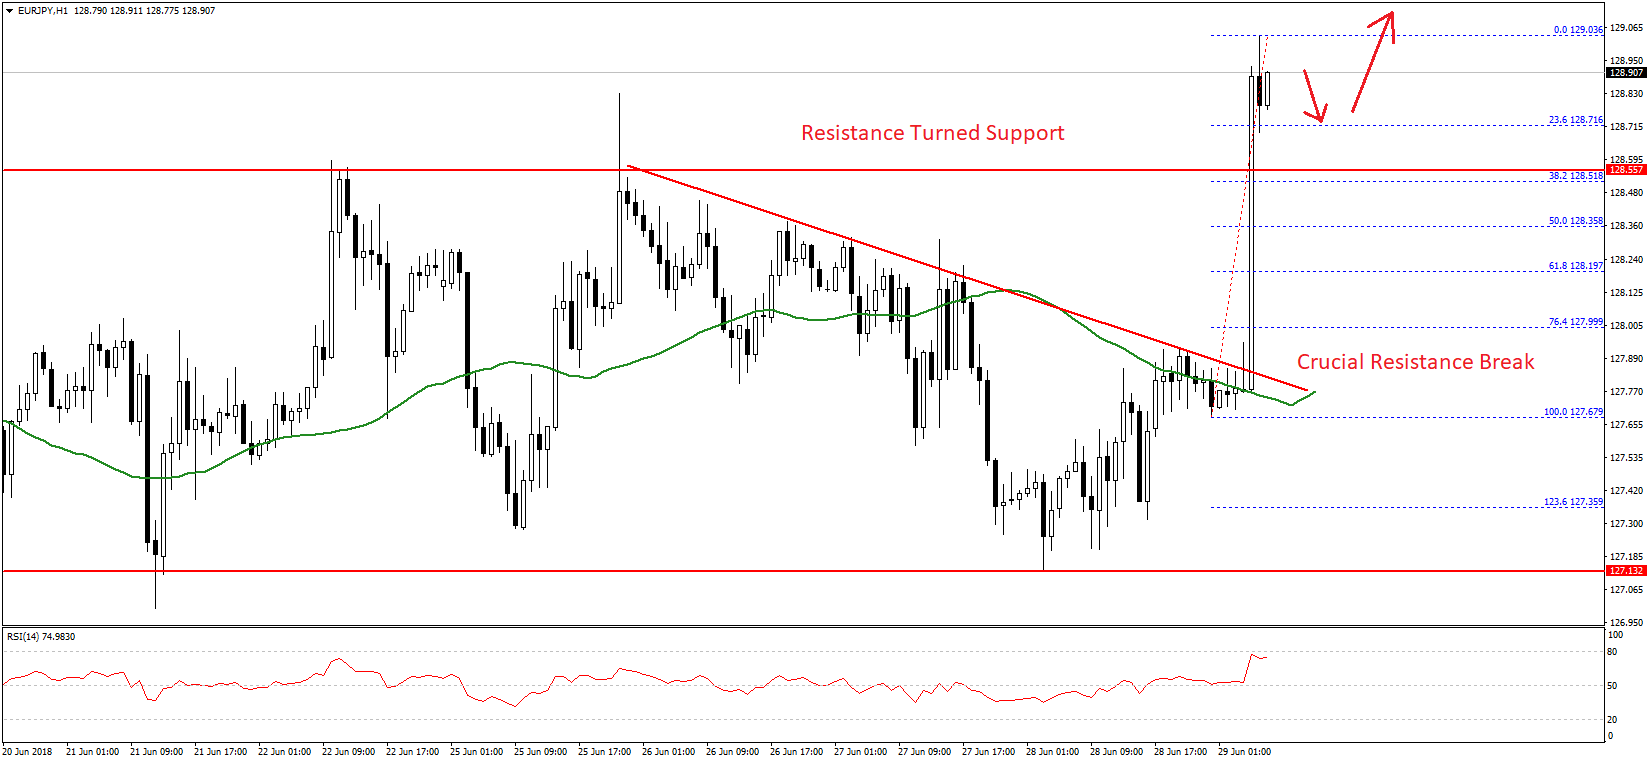
During the upside move, there was a break above a significant bearish trend line at 127.85 on the hourly chart of EUR/JPY. The pair also settled above the 128.00 resistance and the 50 hourly simple moving average.
These all are positive signs and suggest more gains in EUR/JPY above the 128.50 level. The pair recently traded as high as 129.03 and is currently consolidating gains. An initial support is near the 23.6% Fib retracement level of the last wave from the 127.67 low to 129.03 high.
However, the most important support is near the previous resistance at 128.50. It is also the 38.2% Fib retracement level of the last wave from the 127.67 low to 129.03 high.
Therefore, dips remains supported in the short term and there could be more gains in EUR/JPY above the 129.05 and 129.20 levels.
GBP/JPY Technical Analysis
After a major decline below the 144.00 level, the British Pound found support near 143.75 against the Japanese Yen. The GBP/JPY pair traded as low as 143.77 and later it started an upward move.
It gained traction above the 144.00 resistance level and broke the 50% Fib retracement level of the last drop from the 145.75 high to 143.77 low. More importantly, there was a break above a major bearish trend line with resistance at 144.75 on the hourly chart.
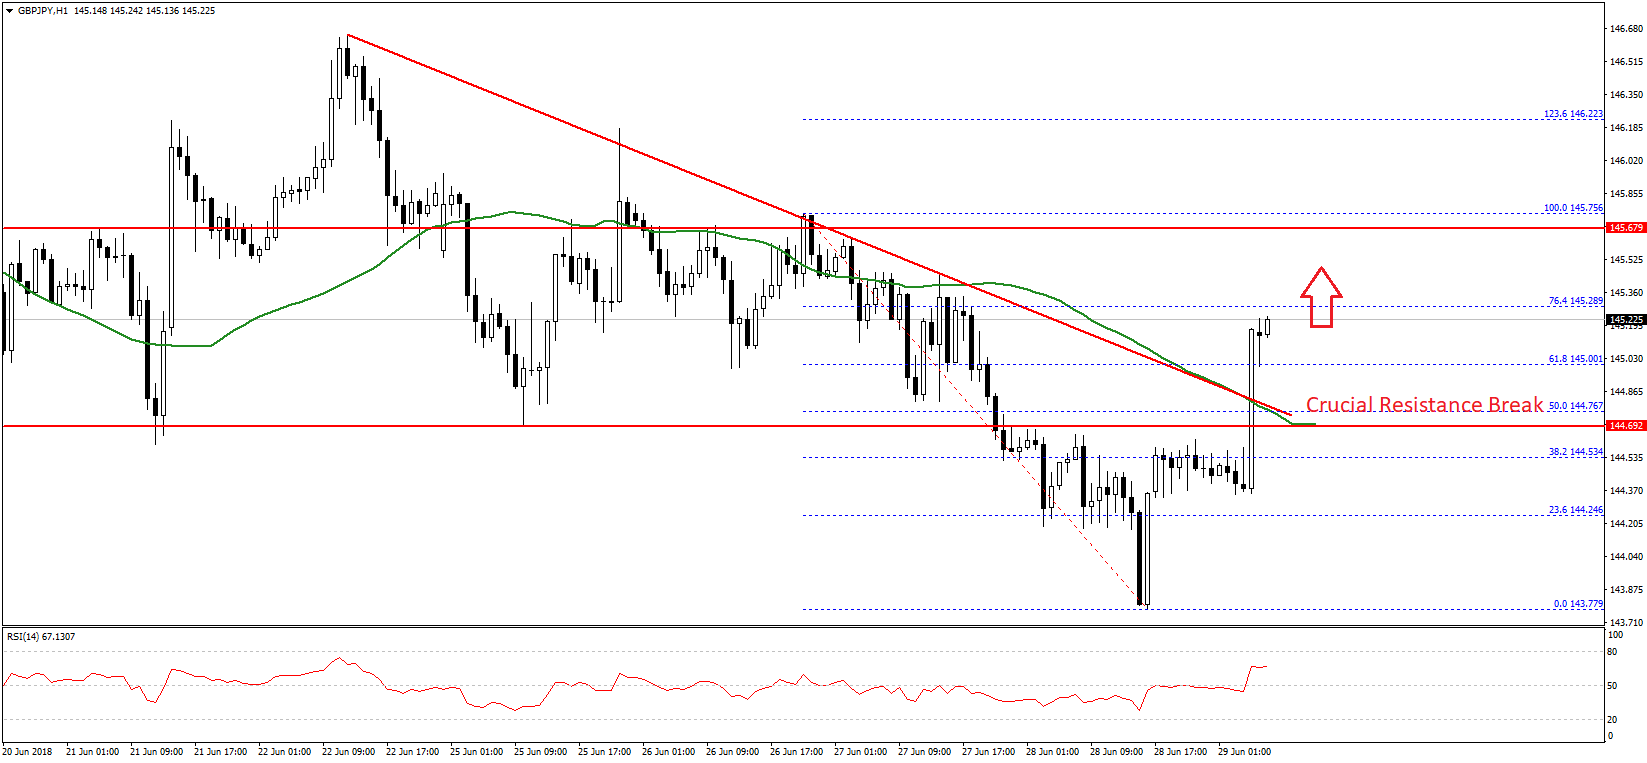
The pair also broke the 145.00 resistance and the 50 hourly simple moving average. The upside move was strong as the pair moved above the 145.20 level. At the moment, the 76.4% Fib retracement level of the last drop from the 145.75 high to 143.77 low is acting as a resistance.
However, the current market sentiment is very positive and it seems like the pair could accelerate gains above the 145.50 level in the near term. Supports are seen near the 145.00 and 144.75 levels.
Today in Japan, Tokyo’s Consumer Price Index for June 2018 was released by the Statistics Bureau. The market was looking for a rise of 0.6% in the CPI (Ex Fresh Food) compared with the same month a year ago.
However, the actual result was positive as Tokyo’s Consumer Price Index Ex Fresh Food increased 0.6%. The Tokyo Consumer Price Index ex Fresh Food and Energy increased 0.4%, more than the forecast of 0.3%.
Open a trading account with FXOpen broker.
Trade over 50 forex markets 24 hours a day with FXOpen. Take advantage of low commissions, deep liquidity, and spreads from 0.0 pips. Open your FXOpen account now or learn more about trading forex with FXOpen.
This article represents the opinion of the Companies operating under the FXOpen brand only. It is not to be construed as an offer, solicitation, or recommendation with respect to products and services provided by the Companies operating under the FXOpen brand, nor is it to be considered financial advice.
Latest from Forex Analysis
Latest articles

Weekly Market Wrap With Gary Thomson: UK100, USD, GOLD, OIL
Get the latest scoop on the week's hottest headlines, all in one convenient video. Join Gary Thomson, the COO of FXOpen UK, as he breaks down the most significant news reports and shares his expert insights.
- UK100 Share Index Rises

What Is a Darvas Box Theory and How Does It Work in Trading?
The Darvas Box Theory, pioneered by Nicolas Darvas in the 1950s, has transcended its stock market origins to become a valuable tool for forex traders. This method leverages specific price movements and patterns, known as the Darvas Box, to track

NFLX Stock Price Falls Despite Subscriber Growth
Yesterday, after the close of the main trading session on the stock market, Netflix reported to investors for the 1st quarter of 2024.
The report turned out better than expected:
→ earnings per share: actual = USD 5.28, forecast = USD 4.