


FXOpen

EUR/USD is following a bullish path above the 1.1850 support area. USD/JPY is currently recovering, but it is likely to face hurdles near the 105.80 and 106.00 levels.
Important Takeaways for EUR/USD and USD/JPY
- The Euro climbed higher nicely and it surpassed the 1.1850 and 1.1900 resistance levels.
- There is a major bullish trend line forming with support near 1.1925 on the hourly chart of EUR/USD.
- USD/JPY declined heavily below the 106.00 and 105.50 support levels.
- There is a connecting bearish trend line forming with resistance near 105.75 on the hourly chart.
EUR/USD Technical Analysis
In the past few days, the Euro gained bullish momentum above the 1.1820 resistance level against the US Dollar. The EUR/USD pair surpassed the 1.1850 resistance zone move further into a positive zone.
The bulls remained in action and the pair broke the 1.1900 pivot level and the 50 hourly simple moving average. The pair traded as high as 1.1966 on FXOpen and it is currently correcting lower. It is trading below the 1.1950 and 1.1940 levels.
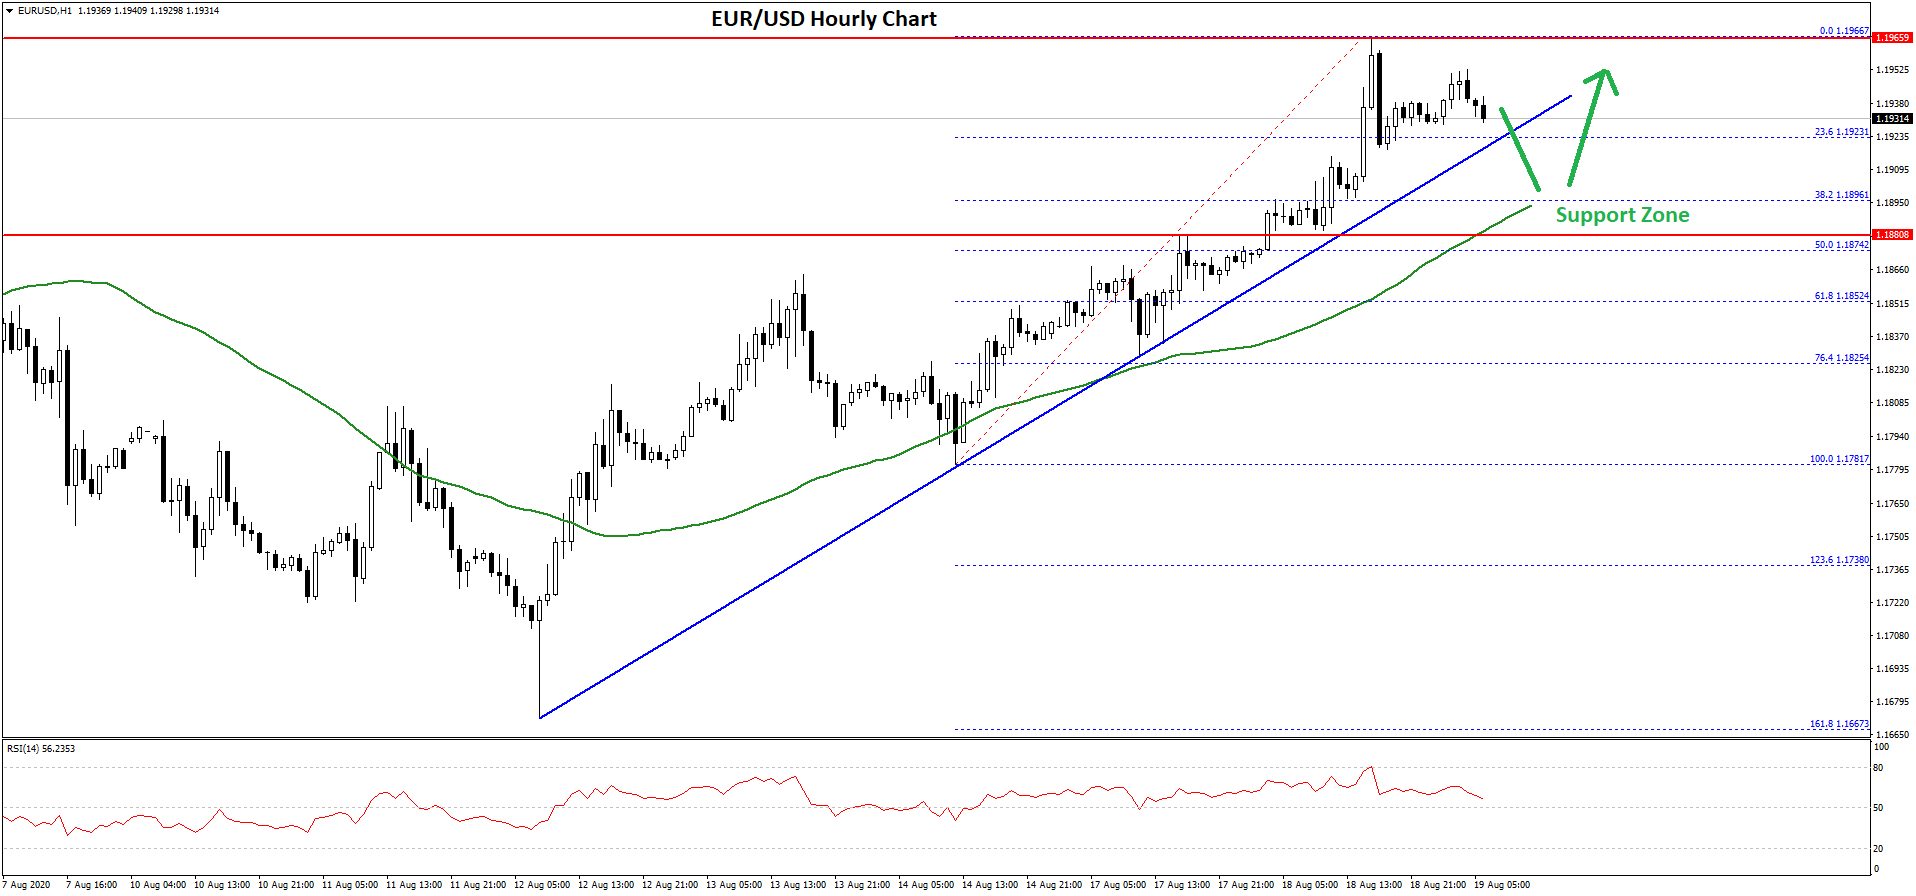
An initial support is near the 1.1925 level. It is close to the 23.6% Fib retracement level of the recent upward move from the 1.1781 low to 1.1966 high. There is also a major bullish trend line forming with support near 1.1925 on the hourly chart of EUR/USD.
If there is a downside break below the trend line support, the pair could correct further lower towards the 1.1900 support or the 50 hourly simple moving average. The next major support is near the 1.1880 level.
The 50% Fib retracement level of the recent upward move from the 1.1781 low to 1.1966 high is also near the 1.1875 level to provide support. Any further losses might push EUR/USD into a bearish zone towards 1.1720.
On the upside, the 1.1950 and 1.1965 levels are immediate hurdles, above which the pair could start a steady increase towards the 1.2000 level in the near term.
USD/JPY Technical Analysis
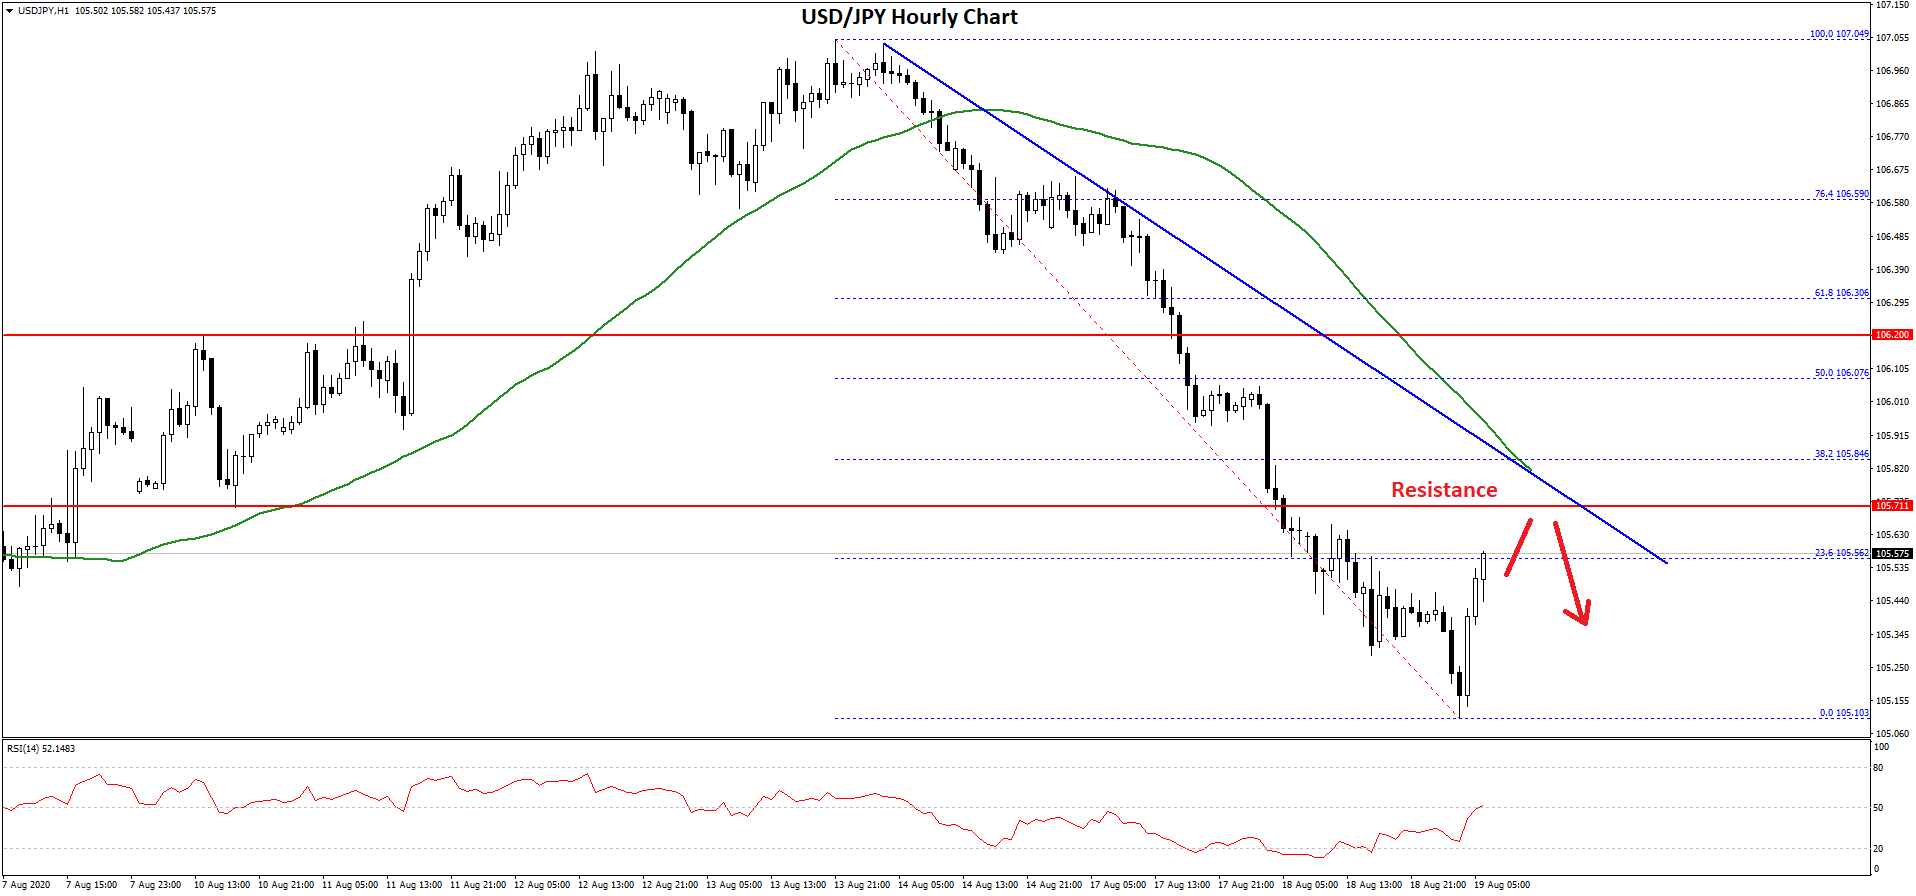
The US Dollar started a strong downward move from well above the 107.00 level against the Japanese Yen. The USD/JPY pair broke the 106.20 support zone to move into a bearish zone.
The decline was such that the pair settled below the 106.00 level and the 50 hourly simple moving average. Finally, it broke the 105.50 level and traded as low as 105.10.
 eue
eue
It is currently correcting higher and trading above 105.40. An immediate resistance is near the 105.55 level. It coincides with the 23.6% Fib retracement level of the downward move from the 107.04 high to 105.10 low.
There is also a connecting bearish trend line forming with resistance near 105.75 on the hourly chart. Above the trend line, the 50 hourly simple moving average is at 105.80.
The next major resistance is near the 106.00 level or the 50% Fib retracement level of the downward move from the 107.04 high to 105.10 low. A successful close above 105.80 and 106.00 is must for a fresh increase in the coming sessions.
On the downside, the 105.20 level is a decent support. The main support is near the 105.00 level, below which the pair could dive towards the 104.20 and 104.00 support levels.
Trade over 50 forex markets 24 hours a day with FXOpen. Take advantage of low commissions, deep liquidity, and spreads from 0.0 pips. Open your FXOpen account now or learn more about trading forex with FXOpen.
This article represents the opinion of the Companies operating under the FXOpen brand only. It is not to be construed as an offer, solicitation, or recommendation with respect to products and services provided by the Companies operating under the FXOpen brand, nor is it to be considered financial advice.
Stay ahead of the market!
Subscribe now to our mailing list and receive the latest market news and insights delivered directly to your inbox.


Latest articles


XBR/USD Chart Analysis: Price Rebounds from a Seven-Week Low
On 1 December, we outlined a descending channel on the XBR/USD chart and noted that the bearish trend was driven by fading geopolitical risks. Indeed, hopes for an end to the war in Ukraine—along with the possibility of

Silver Price Hits Historic Record Around $64
On 27 November, we suggested that silver was preparing to challenge its all-time high. Since then (marked with the orange arrow), XAG/USD has risen by roughly 18%, breaking above the psychological $60-per-ounce threshold for the first time in history.