


EUR/USD Resumes Decline, USD/CHF Eyes More Gains
FXOpen

EUR/USD declined heavily below the 1.0850 and 1.0750 levels. USD/CHF could gain pace if there is a move above the 0.9630 resistance.
Important Takeaways for EUR/USD and USD/CHF
· The Euro started a major decline from the 1.0935 resistance zone against the US Dollar.
· There is a major bearish trend line with resistance near 1.0670 on the hourly chart of EUR/USD.
· USD/CHF formed a base above the 0.9500 support zone and started a decent increase.
· There is a key bullish trend line forming with support near 0.9600 on the hourly chart.
EUR/USD Technical Analysis
The Euro struggled to gain pace above the 1.0920 resistance level against the US Dollar. The EUR/USD pair started a fresh decline below the 1.0850 and 1.0750 support levels.
There was a clear move below the 1.0700 level and the 50 hourly simple moving average. The pair even declined below the 1.0650 support level. It traded as low as 1.0633 on FXOpen and the pair is now consolidating losses.
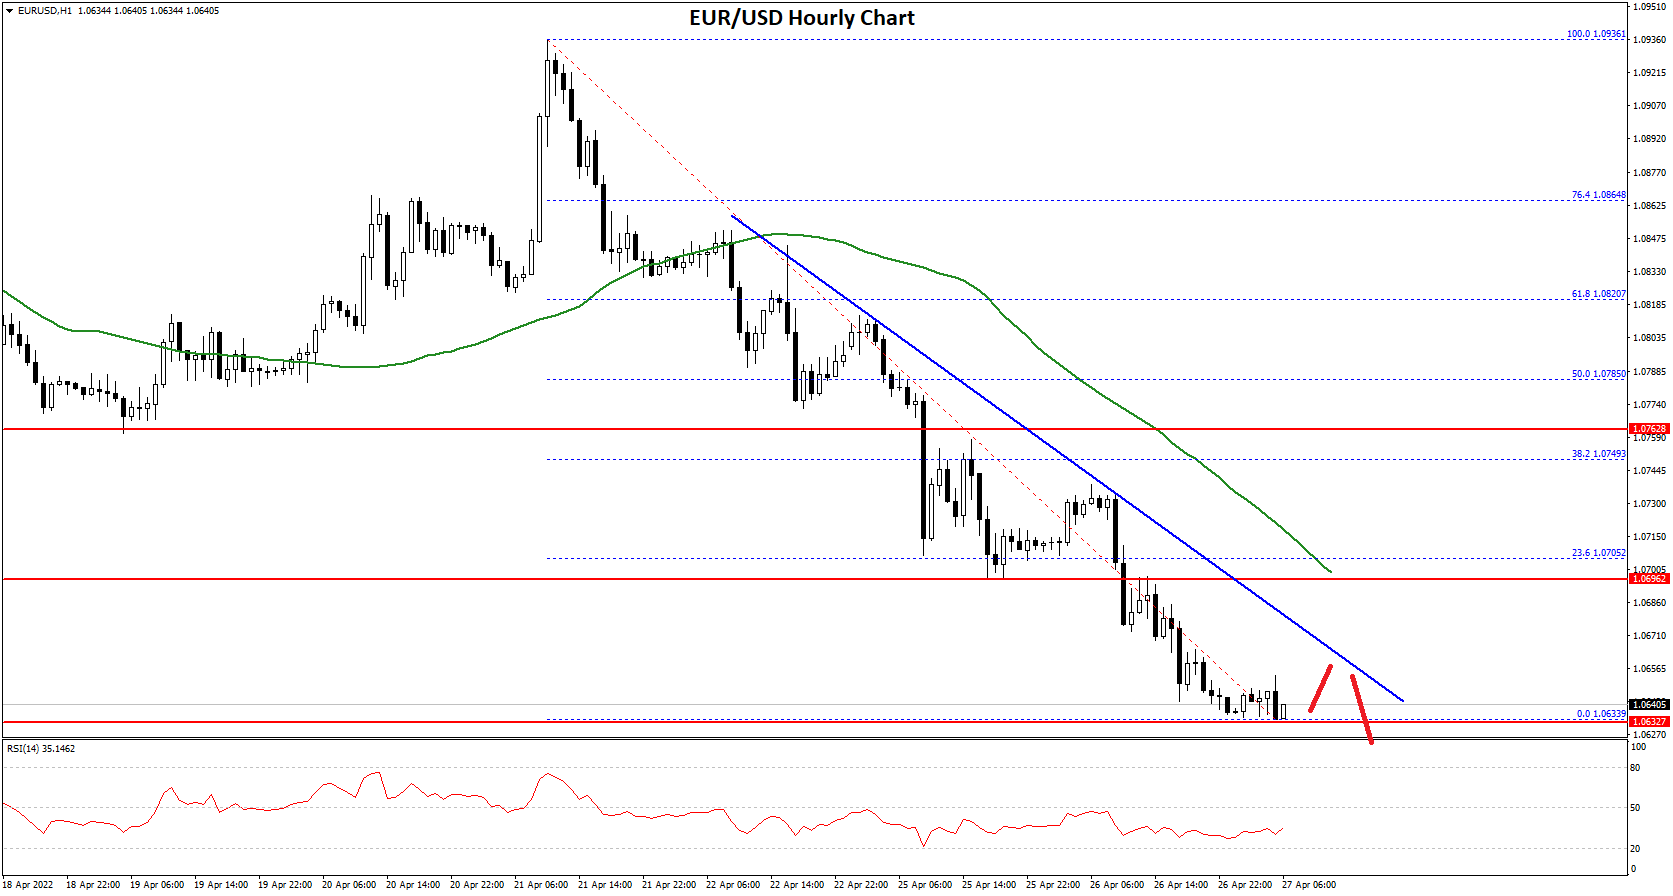
On the upside, an initial resistance is near the 1.0665 level. There is also a major bearish trend line with resistance near 1.0670 on the hourly chart of EUR/USD.
The next major resistance is near the 1.0700 level and the 50 hourly simple moving average. It is near the 23.6% Fib retracement level of the key drop from the 1.0936 swing high to 1.0633 low. The next major resistance is near the 1.0750 zone.
A clear upside break above the 1.0750 zone could open the doors for a steady move. In the stated case, the pair might even surpass the 50% Fib retracement level of the key drop from the 1.0936 swing high to 1.0633 low.
On the downside, an immediate support is near the 1.0635 level. The next major support is near the 1.0600 level. A downside break below the 1.0600 support could start another decline.
USD/CHF Technical Analysis
The US Dollar started a decent increase from the 0.9440 support zone against the Swiss franc. The USD/CHF pair formed a base above 0.9500 to move into a positive zone.
The pair was able to clear the 0.9550 resistance zone and the 50 hourly simple moving average. The bulls pushed the pair above the 0.9600 level. A high is formed near 0.9631 and the pair is now consolidating gains.
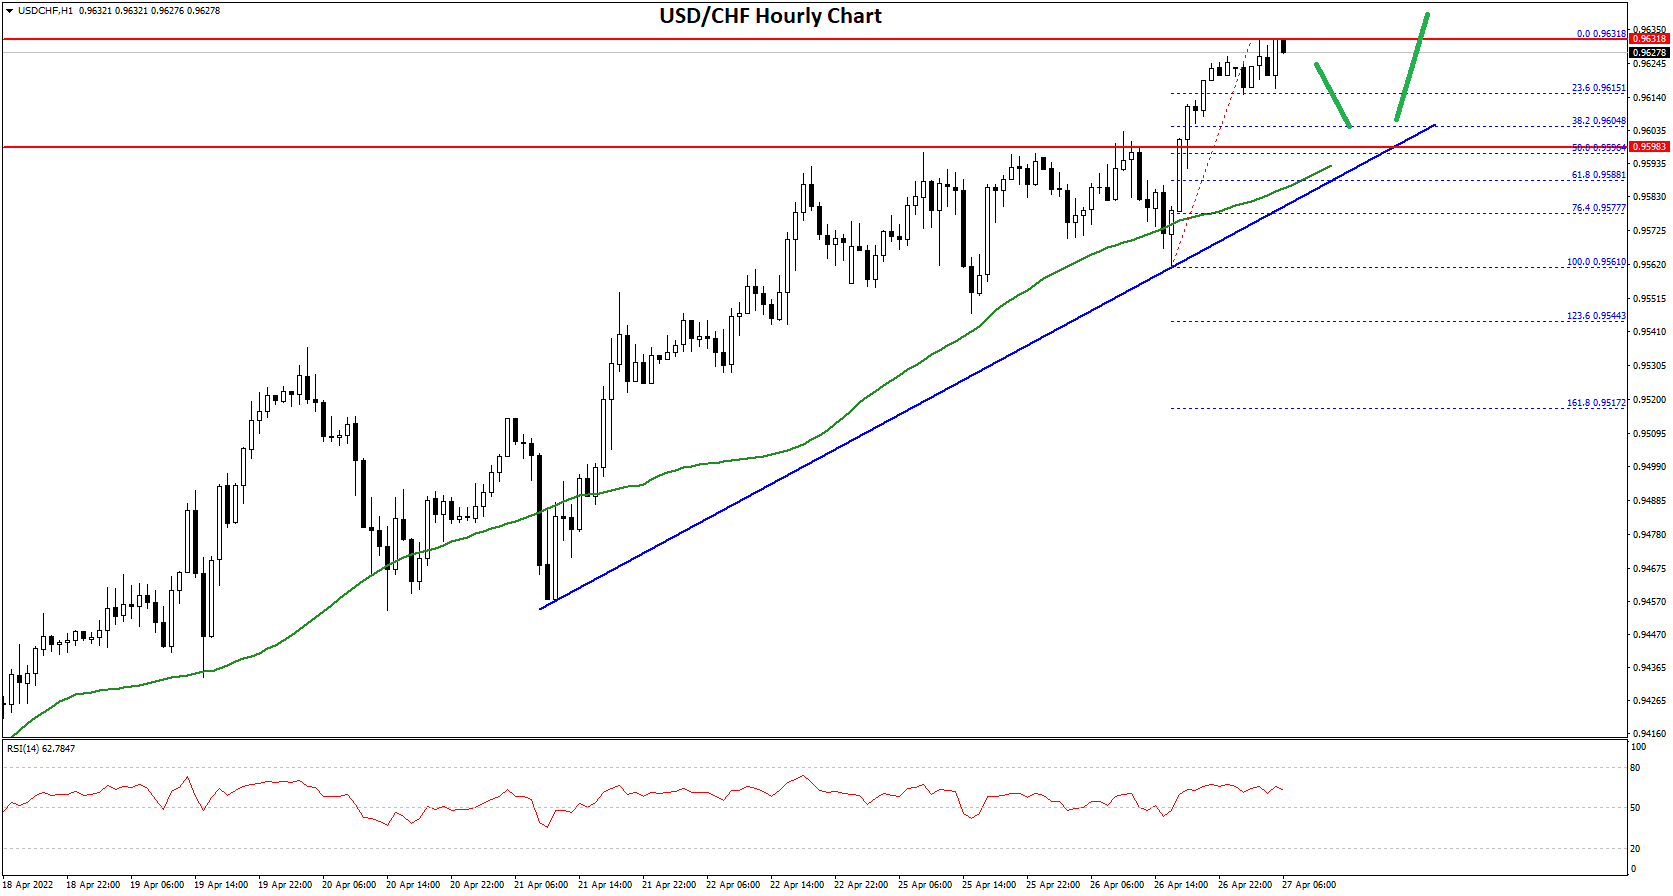
On the downside, the pair might find bids near the 0.9615 level. It is near the 23.6% Fib retracement level of the recent increase from the 0.9561 swing low to 0.9631 high.
The main support is now forming near the 0.9600 level. There is also a key bullish trend line forming with support near 0.9600 on the hourly chart. It is near the 50% Fib retracement level of the recent increase from the 0.9561 swing low to 0.9631 high.
Any more losses may possibly open the doors for a move towards the 0.9550 level. On the upside, the pair is now facing resistance near the 0.9630 level.
The next major resistance is near the 0.9650 level. If there is a clear break above the 0.9650 resistance zone, the pair could start another increase. The next major resistance is near the 0.9700. Any more gains could send the pair towards the 0.9780 level in the near term.
This forecast represents FXOpen Markets Limited opinion only, it should not be construed as an offer, invitation or recommendation in respect to FXOpen Markets Limited products and services or as financial advice.
Trade over 50 forex markets 24 hours a day with FXOpen. Take advantage of low commissions, deep liquidity, and spreads from 0.0 pips (additional fees may apply). Open your FXOpen account now or learn more about trading forex with FXOpen.
This article represents the opinion of the Companies operating under the FXOpen brand only. It is not to be construed as an offer, solicitation, or recommendation with respect to products and services provided by the Companies operating under the FXOpen brand, nor is it to be considered financial advice.
Stay ahead of the market!
Subscribe now to our mailing list and receive the latest market news and insights delivered directly to your inbox.


Latest articles

Ethereum: Has the Recovery Begun?
Ethereum has staged a notable rebound after once again testing the heavily watched psychological zone around 1500$. Since bouncing off this support, ETH/USD has climbed roughly 13%, now trading around the $1,700 mark.
This recovery is being driven

Oil Prices Are Back at Pre-Conflict Levels. Analysts Are Divided
At the start of May, oil markets were still pricing in elevated geopolitical risk and expectations of sustained supply disruption.
But easing tensions between Washington and Tehran, along with improving supply expectations, have rapidly shifted sentiment back toward fundamentals.
📉 Brent

The Dollar Awaits the Week’s Key Report: AUD/USD and NZD/USD at Crucial Technical Levels
Following mixed performance by the US dollar earlier this week, investors are now fully focused on the June Nonfarm Payrolls report, which will be released on Thursday rather than Friday. The schedule has been brought forward as US financial markets