


FXOpen
EUR/USD started a fresh decline from the 1.0940 resistance. EUR/JPY could gain pace if it clears the 136.30 resistance zone.
Important Takeaways for EUR/USD and EUR/JPY
· The Euro failed to clear the 1.0940 resistance and started a fresh decline.
· It broke a key contracting triangle with support near 1.0880 on the hourly chart.
· EUR/JPY gained bullish momentum after it broke the 135.50 resistance zone.
· Recently, there was a break below a major bullish trend line with support near 136.50 on the hourly chart.
EUR/USD Technical Analysis
The Euro made a couple of attempts to clear the 1.0940 resistance zone against the US Dollar. However, the EUR/JPY pair failed to gain strength above 1.0940 and started a fresh decline.
The pair declined below the 1.0900 support and the 50 hourly simple moving average. There was also a break below a key contracting triangle with support near 1.0880 on the hourly chart. The pair even moved below the 1.0840 support level.
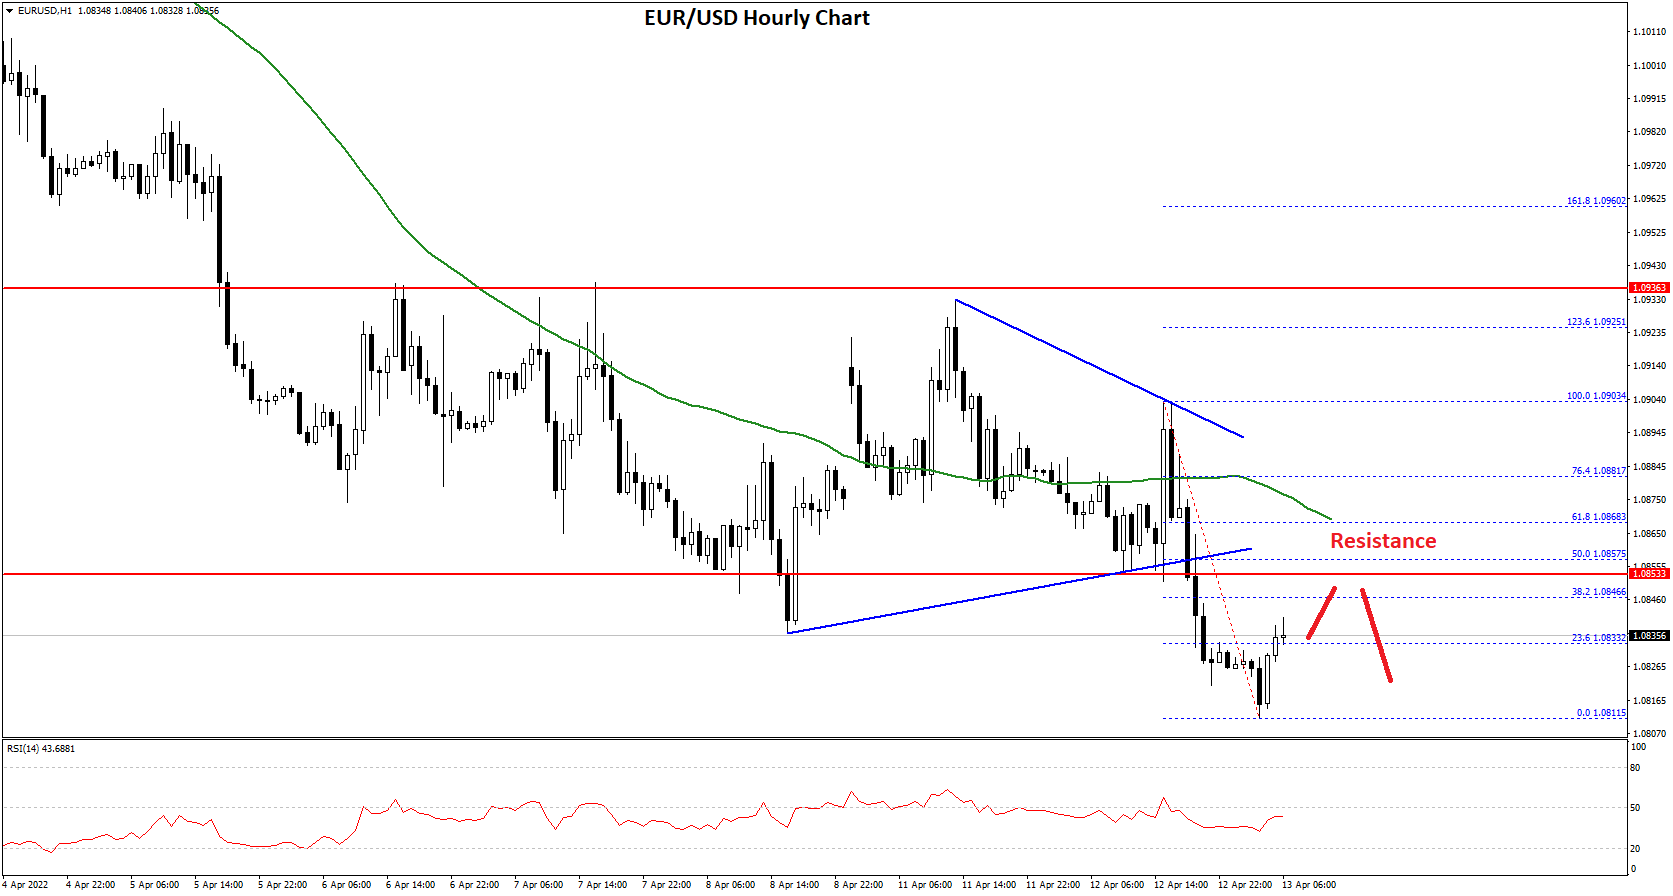
A low is formed near 1.0811 on FXOpen and the pair is now consolidating losses. It corrected above the 23.6% Fib retracement level of the recent decline from the 1.0903 high to 1.0811 low.
On the upside, the pair is facing resistance near the 1.0850 level. It is near the 50% Fib retracement level of the recent decline from the 1.0903 high to 1.0811 low. The next major resistance is near the 1.0865 level and the 50 hourly simple moving average.
A clear break above the 1.0865 resistance could push EUR/USD towards 1.0900. If the bulls remain in action, the pair could rise revisit the 1.0940 resistance zone in the near term.
On the downside, the pair might find support near the 1.0820 level. If there is a downside break below the 1.0820 support, the pair might accelerate lower. The next major support sits near the 1.0765 level, below which there is a risk of a larger decline.
EUR/JPY Technical Analysis
The Euro started a major increase above the 135.00 resistance against the Japanese Yen. The EUR/JPY pair gained pace and was able to surpass the 135.50 resistance zone.
It even climbed above the 136.20 level and the 50 hourly simple moving average. It traded as high as 137.12 before it started a downside correction. There was a move below the 136.80 level. The pair declined below the 23.6% Fib retracement level of the upward move from the 134.35 swing low to 137.12 high.
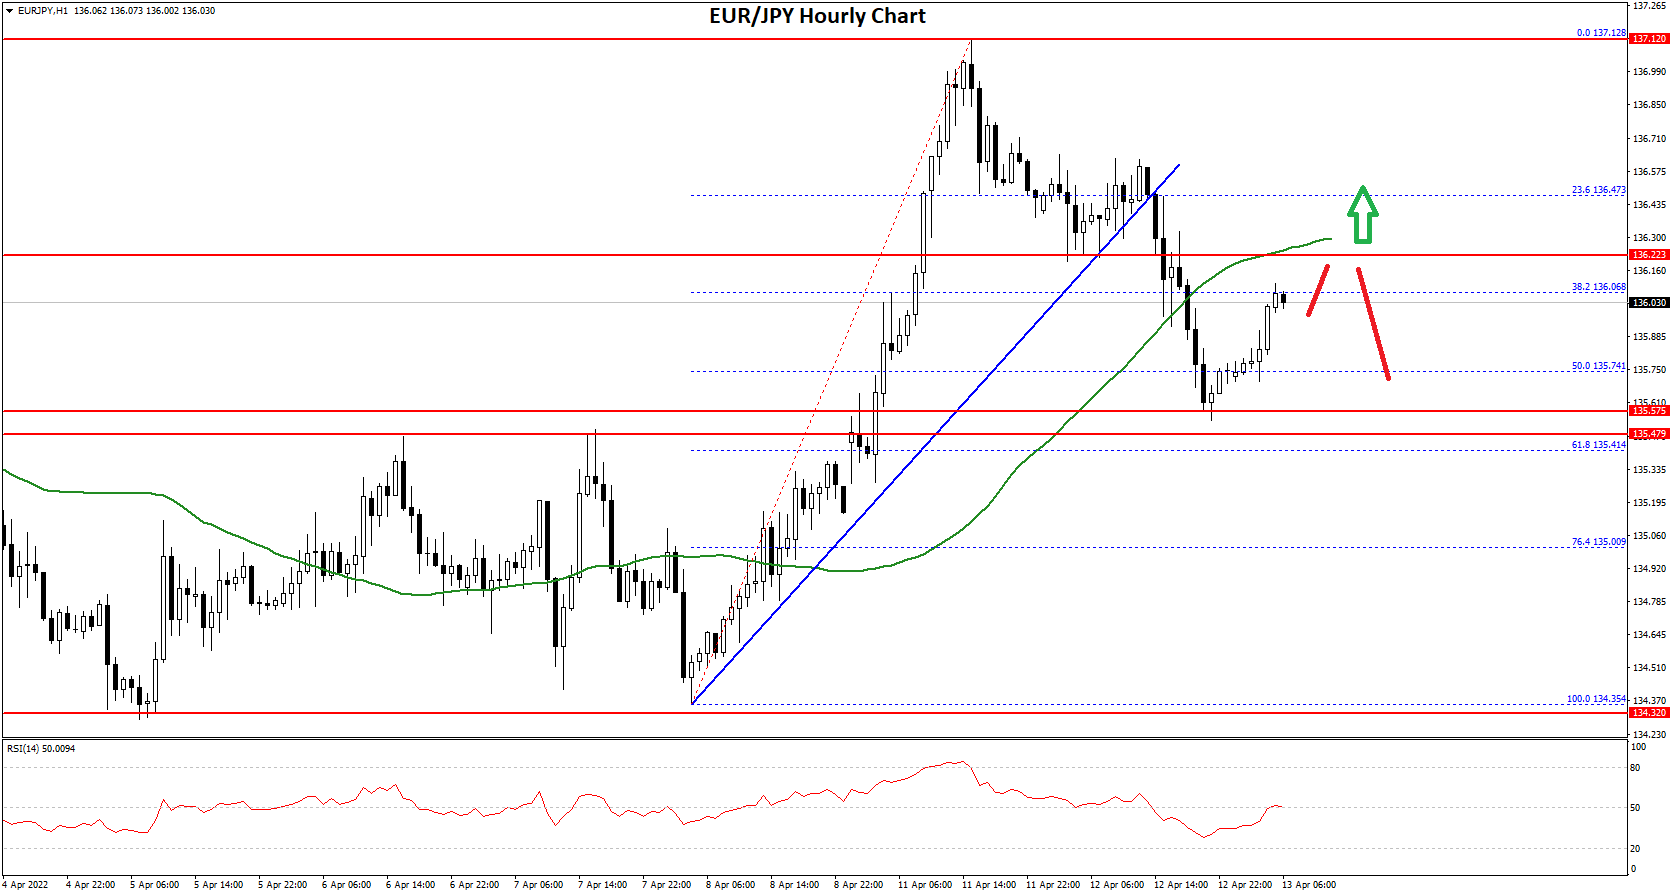
There was a break below a major bullish trend line with support near 136.50 on the hourly chart. The pair even spiked below the 50% Fib retracement level of the upward move from the 134.35 swing low to 137.12 high.
The next major support is near the 135.75 level. The main support sits near the 135.50 level. Any more losses could lead the pair towards the 135.00 support level in the near term.
On the upside, an immediate resistance is near the 136.20 level. If there is an upside break above the 136.20 resistance, the pair could test the 136.50 resistance.
The next major resistance could be near the 137.00 level, above which the pair could gain bullish momentum. In the stated case, the pair could rise towards the 137.50 level.
This forecast represents FXOpen Markets Limited opinion only, it should not be construed as an offer, invitation or recommendation in respect to FXOpen Markets Limited products and services or as financial advice.
Trade over 50 forex markets 24 hours a day with FXOpen. Take advantage of low commissions, deep liquidity, and spreads from 0.0 pips (additional fees may apply). Open your FXOpen account now or learn more about trading forex with FXOpen.
This article represents the opinion of the Companies operating under the FXOpen brand only. It is not to be construed as an offer, solicitation, or recommendation with respect to products and services provided by the Companies operating under the FXOpen brand, nor is it to be considered financial advice.
Stay ahead of the market!
Subscribe now to our mailing list and receive the latest market news and insights delivered directly to your inbox.


Latest articles


XAG/USD Analysis: Silver Drops to March Low
As seen on the XAG/USD chart, the price of silver fell to the $70 level and briefly pierced it, marking the lowest level since early February.
Although geopolitical tensions typically support demand for safe-haven assets, silver is under pressure

XBR/USD Analysis: Brent Crude Rises Above $110
Yesterday, Brent crude prices moved sharply higher, with the XBR/USD chart showing breakouts above local resistance levels. Today, the price has climbed above the $110 mark, bringing it close to the multi-year high recorded on 9 March.
The bullish