


FXOpen
EUR/USD remained in a solid downtrend and broke the 1.1400 support. Conversely, USD/JPY is following a solid uptrend and it could continue higher towards 114.00.
Important Takeaways for EUR/USD and USD/JPY
- The Euro declined recently and broke the 1.1460 and 1.1400 support levels.
- There is a major bearish trend line in place with resistance at 1.1370 on the hourly chart of EUR/USD.
- USD/JPY surpassed a crucial bearish trend line with resistance at 112.50 on the hourly chart.
- The pair is currently in a positive zone above the 113.00 and 112.85 support levels.
EUR/USD Technical Analysis
The Euro was under a lot of selling pressure recently as it broke the 1.1500 support area against the US Dollar. The EUR/USD pair also broke the 1.1460 and 1.1400 support levels to enter a bearish zone.
The pair is clearly following a downtrend from well above 1.1550 with a lot of bearish moves. It recently declined below the 1.1370 level and settled below the 50 hourly simple moving average.
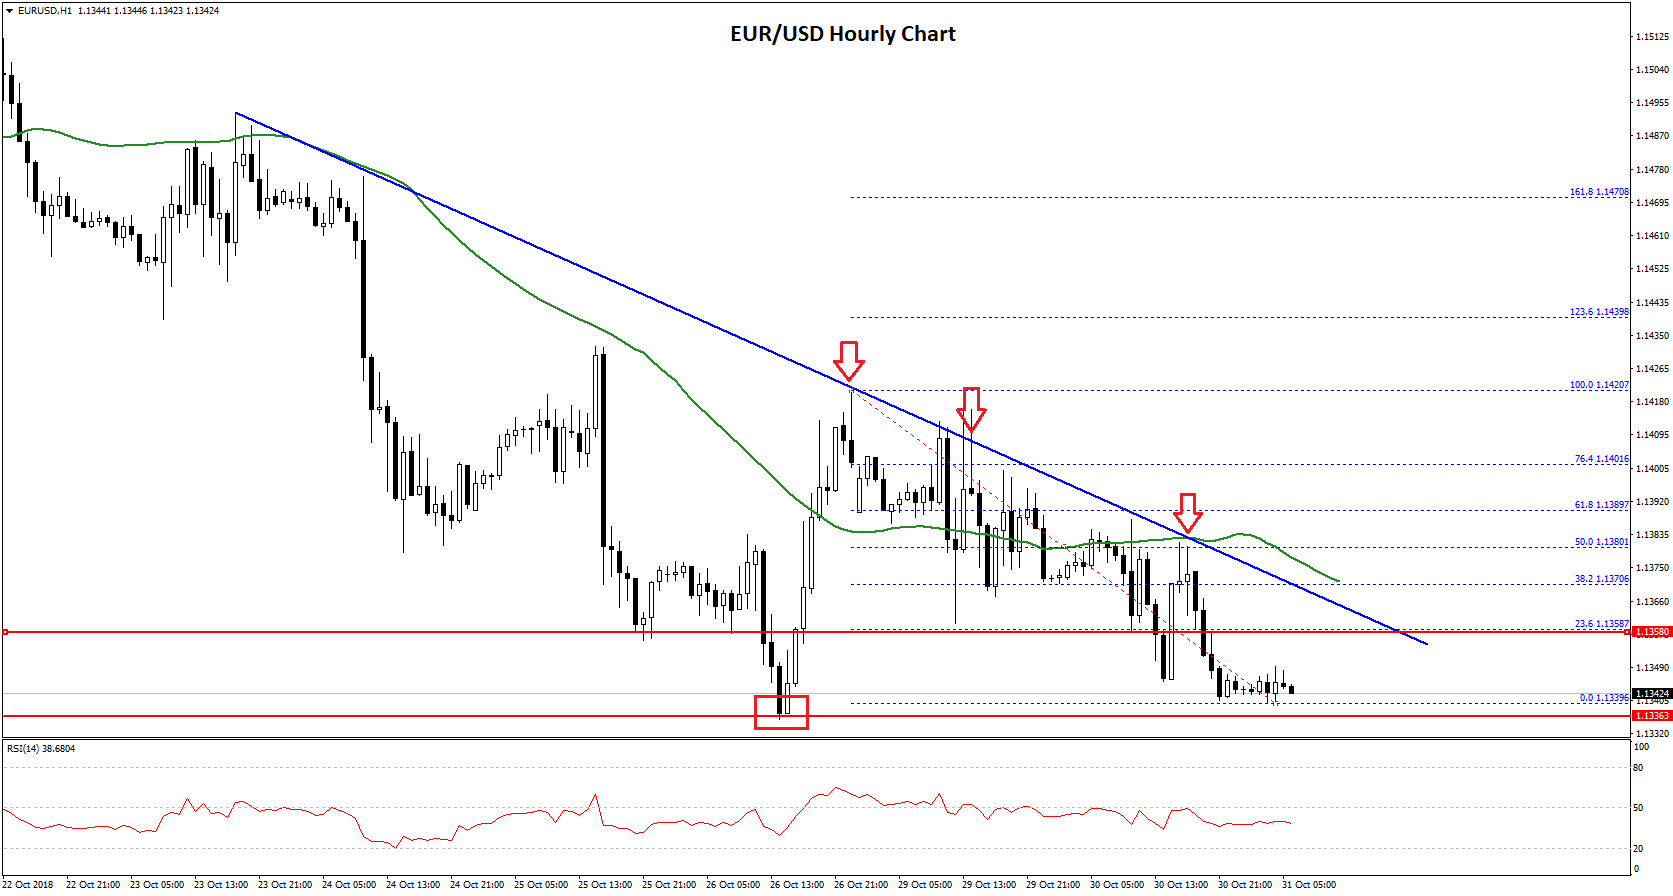
The decline was such that the pair traded close to the 1.1330 level. A low was formed at 1.1335 before the pair stared consolidating losses. It corrected above the 1.1400 level, but buyers failed to gain momentum.
As a result, the pair declined once more and traded towards 1.1340. The pair is currently at a risk of a downside break below the 1.1340 level and the 1.1335 swing low. The next main support below the 1.1335 low is near 1.1320 followed by the 1.1300 level.
On the upside, an initial resistance is near the 23.6% Fib retracement level of the recent decline from the 1.1420 high to 1.1339 low. Moreover, there is a major bearish trend line in place with resistance at 1.1370 on the hourly chart of EUR/USD.
The trend line is close to the 38.2% Fib retracement level of the recent decline from the 1.1420 high to 1.1339 low. Therefore, if the pair corrects higher from the current levels, it could face a lot of sellers near the 1.1360, 1.1370 and 1.1375 levels.
USD/JPY Technical Analysis
After dipping below the 111.60 support, the US Dollar found support near the 111.50 level against the Japanese Yen. The USD/JPY pair started a solid upward move and traded above the 111.80 and 112.00 resistance levels.
The upside move was strong as the pair even cleared the 112.50 resistance and the 50 hourly simple moving average. Moreover, there was a break above a crucial bearish trend line with resistance at 112.50 on the hourly chart.
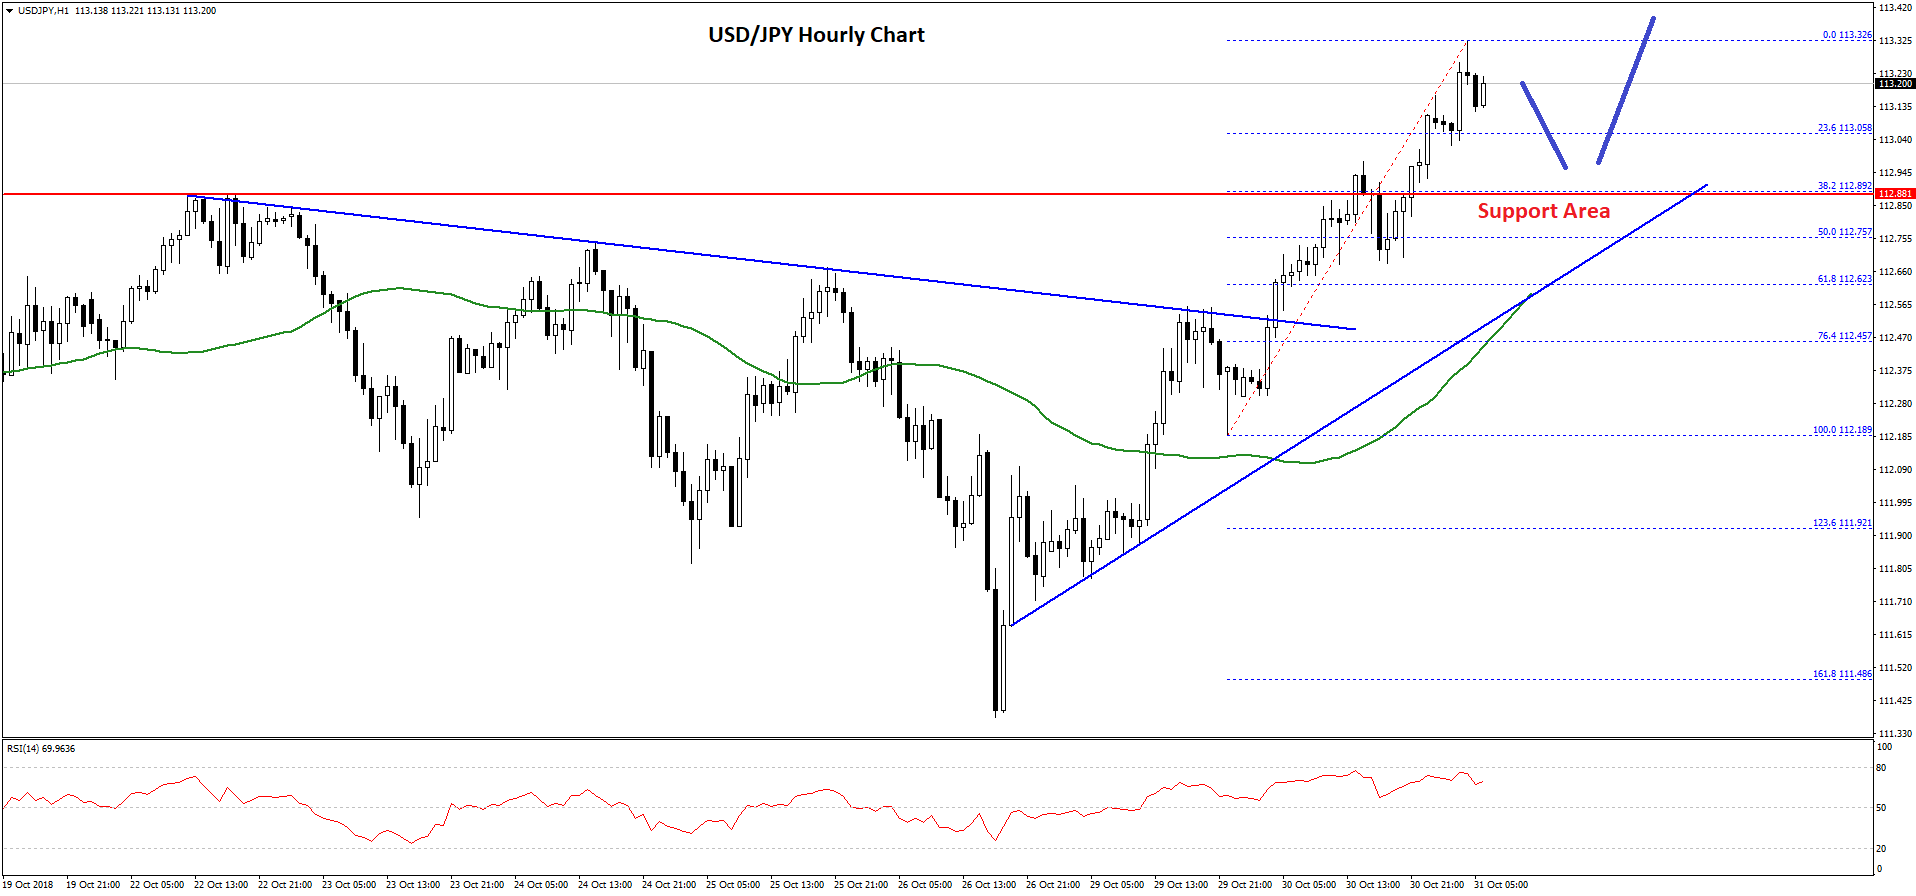
The pair traded as high as 113.26 and it is currently correcting lower. An initial support is near the 23.6% Fib retracement level of the recent wave from the 112.18 low to 113.32 high.
However, the most important support on the downside is near the previous resistance at 112.88. Moreover, there is a connecting bullish trend line in place on the same chart with support at 112.75.
The trend line coincides with the 50% Fib retracement level of the recent wave from the 112.18 low to 113.32 high. Therefore, dips from the current levels in USD/JPY are likely to find buyers near the 113.00, 112.85 and 112.75 levels.
On the upside, a break above the recent high of 113.32 could open the doors for a push towards the 114.00 level in the near term.
Trade over 50 forex markets 24 hours a day with FXOpen. Take advantage of low commissions, deep liquidity, and spreads from 0.0 pips. Open your FXOpen account now or learn more about trading forex with FXOpen.
This article represents the opinion of the Companies operating under the FXOpen brand only. It is not to be construed as an offer, solicitation, or recommendation with respect to products and services provided by the Companies operating under the FXOpen brand, nor is it to be considered financial advice.
Latest from Forex Analysis
Latest articles

Anchored VWAP and How You Can Use It in Forex Trading
In the world of forex trading, understanding the nuanced tools at your disposal can significantly enhance decision-making processes. One such sophisticated tool is the Anchored Volume-Weighted Average Price (Anchored VWAP), which refines the standard VWAP by allowing traders to set

META Share Price Collapses after Publication of Quarterly Report
Just yesterday, META's stock price closed at USD 493.50, up approximately 40% since the start of 2024 and up nearly 300% since the start of 2023.
However, following the release of Meta's quarterly report, its shares plummeted to USD

USD/JPY Analysis: The Rate Exceeds The Level of 155 Yen Per US Dollar
Today, the price of USD/JPY once again renewed its 34-year high, exceeding the level of 155 yen per dollar, which put pressure on the current authorities.
According to Reuters, officials are trying to maintain calm in the market.
"We