


EUR/USD Faces Hurdle, USD/JPY Remains At Risk
FXOpen

EUR/USD started a fresh decline from well above 1.1650. USD/JPY is facing resistance near 114.00 and it might start a fresh decline in the near term.
Important Takeaways for EUR/USD and USD/JPY
· The Euro started a major decline below the 1.1650 and 1.1620 support levels.
· There was a break below a key bullish trend line with support near 1.1590 on the hourly chart of EUR/USD.
· USD/JPY is facing a major resistance near the 114.00 and 114.20 levels.
· There was a break below a key bullish trend line with support near 113.95 on the hourly chart.
EUR/USD Technical Analysis
This past week, the Euro started a major decline from the 1.1690 zone against the US Dollar. The EUR/USD pair traded below the 1.1650 support to move into a bearish zone.
The pair even broke the 1.1620 level and settled below the 50 hourly simple moving average. A low is formed near 1.1535 on FXOpen and the pair is now correcting losses. It recovered above the 1.1550 resistance level.
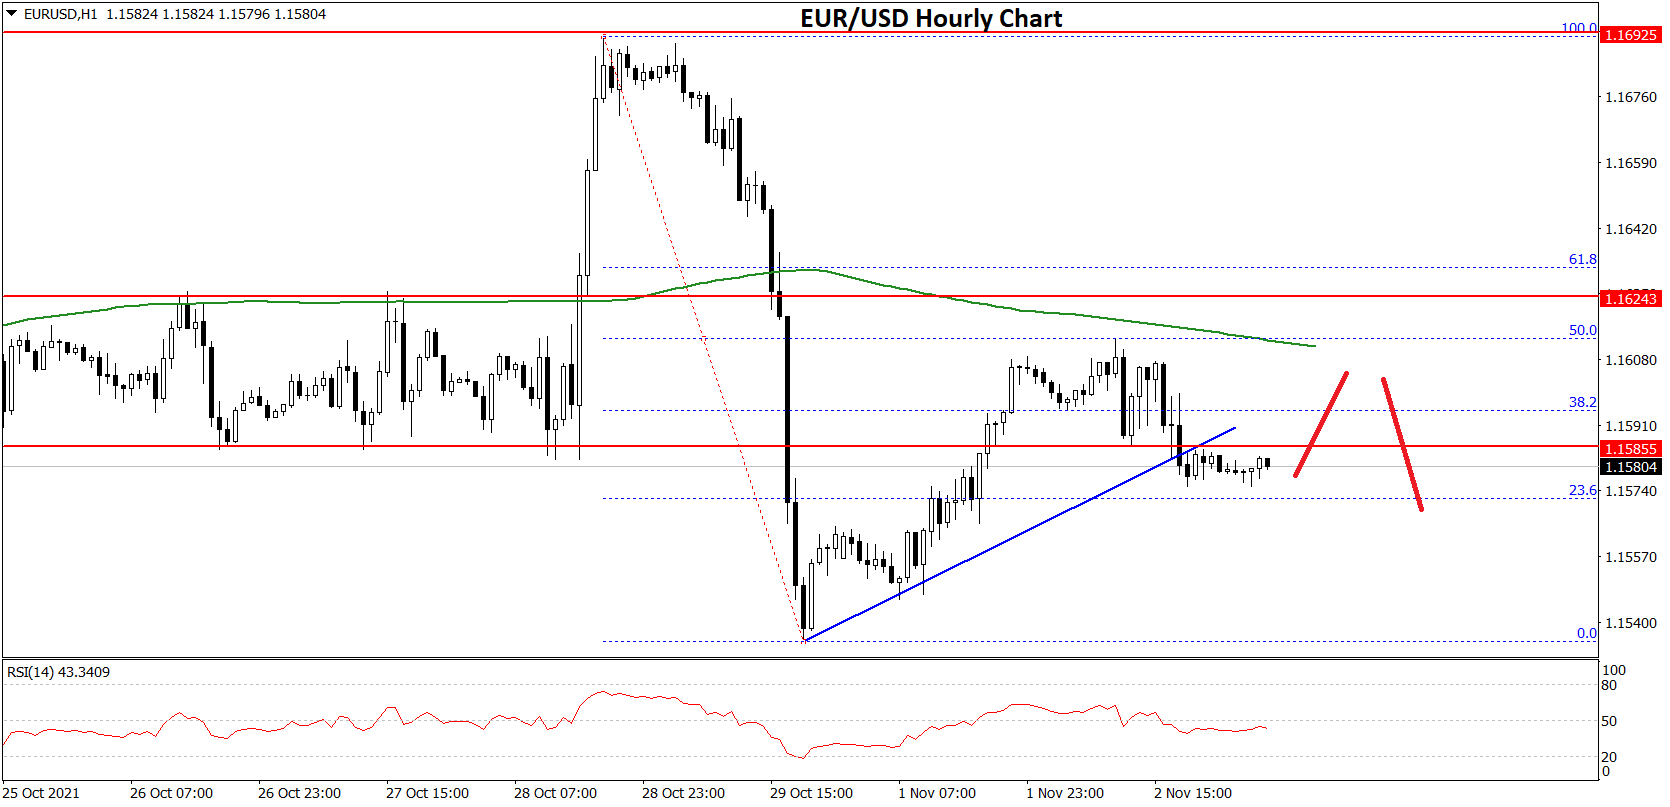
There was a break above the 23.6% Fib retracement level of the recent decline from the 1.1691 swing high to 1.1535 low. It is now facing resistance near the 1.1600 level.
The pair failed to clear the 1.1600 resistance and the 50 hourly SMA. There was also a failure near the 50% Fib retracement level of the recent decline from the 1.1691 swing high to 1.1535 low. As a result, the pair started a fresh decline below 1.1580.
There was a break below a key bullish trend line with support near 1.1590 on the hourly chart of EUR/USD. An immediate support is near the 1.1575.
The next major support is near 1.1550, below which the pair could drop towards the 1.1525 support in the near term. Any more losses may perhaps push the pair towards 1.1500. An immediate resistance is near the 1.1595 level.
The next major resistance is near the 1.1600 level. A clear break above the 1.1600 zone could open the doors for a larger increase. In the stated case, the pair could rise steadily towards the 1.1650 level in the near term.
USD/JPY Technical Analysis
The US Dollar started a fresh decline from the 114.50 zone against the Japanese Yen. The USD/JPY pair broke the 114.20 and 114.00 support levels to move into a short-term bearish zone.
There was a clear break below the 113.80 level and the 50 hourly simple moving average. Besides, there was a break below a key bullish trend line with support near 113.95 on the hourly chart. The pair traded as low as 113.45 and it is now correcting losses.
There was a recovery wave above the 113.80 resistance level. The pair surpassed the 23.6% Fib retracement level of the downward move from the 114.43 swing high to 113.46 low. On the upside, an initial resistance is near the 113.95 level. The next major resistance is near the 114.00 level.
The 50% Fib retracement level of the downward move from the 114.43 swing high to 113.46 low is also near the 114.00 level. A close above the 114.00 level could lift the pair towards 114.50 in the coming sessions.
On the downside, an initial support is near the 113.65 level. The next major support is near the 113.50 level. Any more downsides might lead the pair towards the 113.00 support zone.
This forecast represents FXOpen Markets Limited opinion only, it should not be construed as an offer, invitation or recommendation in respect to FXOpen Markets Limited products and services or as financial advice.
This article represents the opinion of the Companies operating under the FXOpen brand only. It is not to be construed as an offer, solicitation, or recommendation with respect to products and services provided by the Companies operating under the FXOpen brand, nor is it to be considered financial advice.
Stay ahead of the market!
Subscribe now to our mailing list and receive the latest market news and insights delivered directly to your inbox.


Latest articles

CAD/JPY: The Yen's Most Historic Move in 30 Years Meets a Fragile Support
Two central banks are heading in genuinely opposite directions this week, and the tension is unmistakable. The Bank of Canada held rates steady at 2.25% on September 2, with a mildly hawkish tilt as policymakers acknowledged a broadening economic

USD/JPY and USD/CAD Await Key Fed Decision
The US dollar is consolidating against the yen and Canadian dollar ahead of the key event of the week — the Federal Reserve meeting. The Fed is widely expected to raise its policy rate by 25 basis points to a range

UnitedHealth: Fundamentals Are Healing, Now the Chart Must Agree
UnitedHealth finds itself in a genuinely split narrative right now, trading near $388, down about 15.9% from its 52-week high, even as the fundamental picture keeps improving. Q2 earnings beat expectations, with revenue of $112.03 billion, and the