


FXOpen

EUR/USD is under pressure and it recently broke the 1.1120 support area. USD/JPY is showing positive signs and it seems like there could be more upsides above 106.00.
Important Takeaways for EUR/USD and USD/JPY
- The Euro failed to break the 1.1150 resistance and declined recently below the 1.1120 support.
- There is a major declining channel forming with resistance near 1.1105 on the hourly chart of EUR/USD.
- USD/JPY is showing positive signs and is trading nicely above the 105.60 support area.
- There is a key bearish trend line forming with resistance near 105.90 on the hourly chart.
EUR/USD Technical Analysis
This past week, the Euro recovered above the 1.1120 and 1.1140 levels against the US Dollar. However, the EUR/USD pair failed to gain traction above the 1.1150 and 1.1160 levels. As a result, a fresh bearish wave was initiated below the 1.1140 level.
A swing high was formed near 1.1163 on FXOpen and the pair broke the key 1.1120 support level to move into a bearish zone. Moreover, there was a close below 1.1100 and the 50 hourly simple moving average.
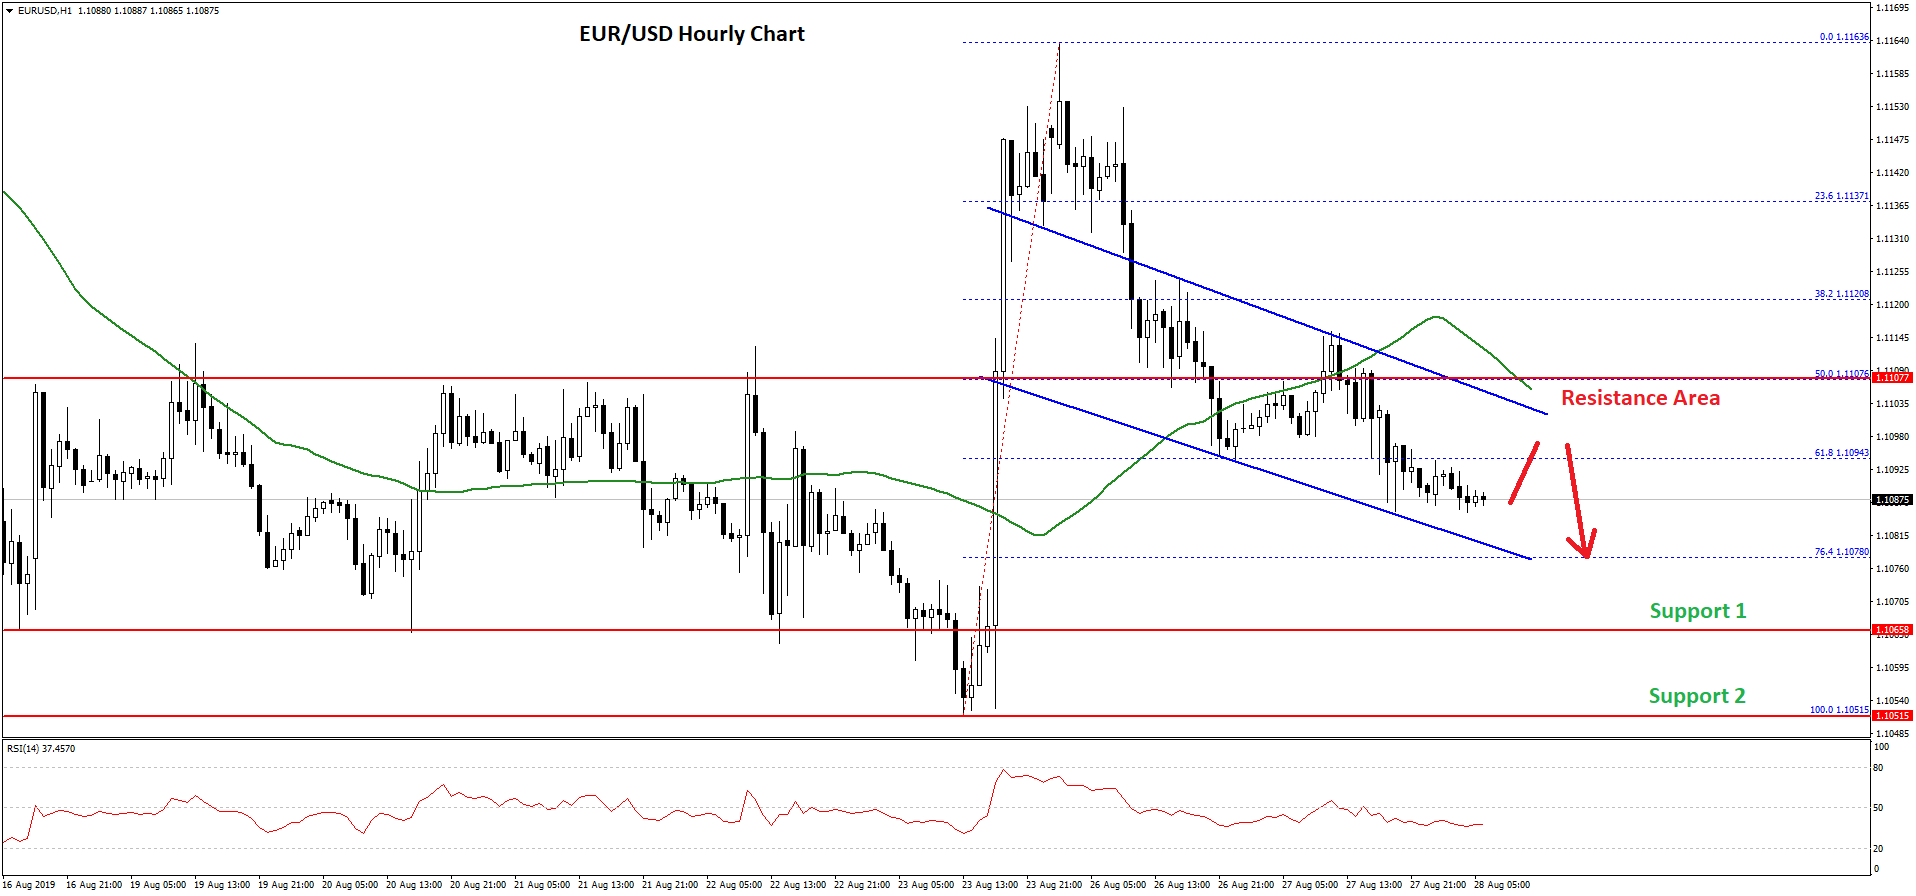
Moreover, there was a break below the 50% Fib retracement level of the upward move from the 1.1050 swing low to 1.1163 high. The price is now trading well below 1.1100 and the 50 hourly SMA.
There is also a major declining channel forming with resistance near 1.1105 on the hourly chart of EUR/USD. The pair needs to break the 1.1100 resistance, the channel resistance, and the 50 hourly simple moving average to start a decent recovery.
The next key resistance is near the 1.1120 level, above which the pair could trade towards the 1.1150 level. Conversely, the pair might continue to move down below 1.1085. An immediate support is near the 76.4% Fib retracement level of the upward move from the 1.1050 swing low to 1.1163 high.
If EUR/USD breaks the 1.1080 support, it could revisit the main 1.1050 support area in the coming sessions.
USD/JPY Technical Analysis
This past week, there was a sharp decline in the US Dollar below the 106.00 support against the Japanese Yen. The USD/JPY pair even broke the 105.20 support level and traded below 105.00.
It traded towards 104.50 and a swing low was formed near 104.45. Recently, the pair started a strong recovery and climbed above the 105.00 and 105.40 resistance levels. Moreover, there was a break above the 106.00 level and the 50 hourly simple moving average.
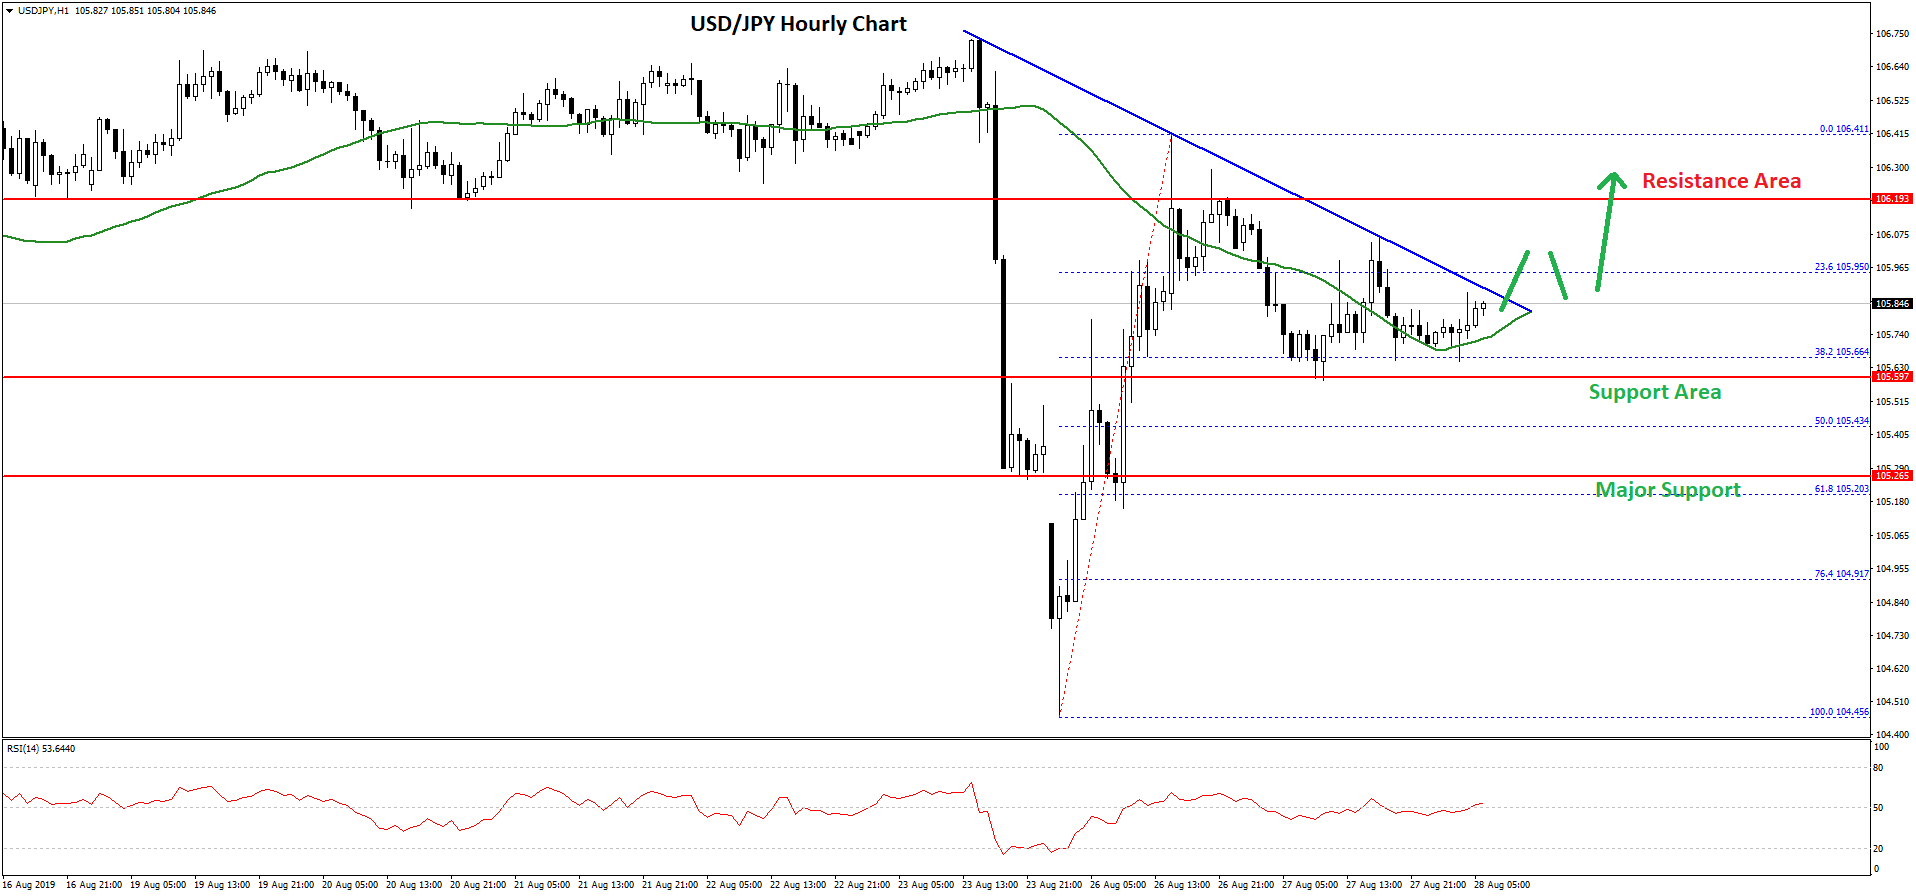
However, the pair struggled to break the 106.40 level and recently corrected lower below 106.00 plus the 23.6% Fib retracement level of the last wave from the 104.45 low to 106.40 high.
At the moment, the 105.60 level is acting as a support and the pair is showing positive signs. On the upside, there is a key bearish trend line forming with resistance near 105.90 on the hourly chart.
If there is an upside break above 105.90 and 106.00, the pair could continue to move higher. The next key resistance is near the 106.20 and 106.40 levels.
Conversely, if the pair fails to climb above 106.00, it could trim gains. The main support on the downside is near the 105.40 level. It represents the 50% Fib retracement level of the last wave from the 104.45 low to 106.40 high. Moreover, the 105.25 level is also a crucial support zone.
Trade over 50 forex markets 24 hours a day with FXOpen. Take advantage of low commissions, deep liquidity, and spreads from 0.0 pips. Open your FXOpen account now or learn more about trading forex with FXOpen.
This article represents the opinion of the Companies operating under the FXOpen brand only. It is not to be construed as an offer, solicitation, or recommendation with respect to products and services provided by the Companies operating under the FXOpen brand, nor is it to be considered financial advice.
Latest from Forex Analysis
Latest articles

What Order Imbalance Is and How To Use It in a Trading Strategy
Understanding the nuances of order imbalances is key for traders looking to navigate the ebb and flow of asset prices. Order imbalances provide a clear window into the supply and demand dynamics at play, offering strategic insights. This article delves

XAU/USD Gold Price Reaches an Important Resistance Zone
The XAU/USD gold chart today indicates that the historical record price of the metal is above USD 2,400 per ounce.
In addition to fears of a new round of inflation due to rising commodity prices, geopolitical tensions are

What Is a Break of Structure and How Can You Trade It?
In the ever-evolving world of Smart Money Concept (SMC) trading, a nuanced understanding of market dynamics is indispensable. This article explores the concept of Break of Structure (BOS), how to identify it, and its implications for trading strategies, setting traders