


FXOpen
EUR/USD failed to move above 1.1750 and started a downward move. USD/CHF is recovering nicely after trading as low as 0.9900.
Important Takeaways for EUR/USD and USD/CHF
- The Euro faced a strong resistance near the 1.1750 level against the US Dollar.
- A bearish trend line is in place with resistance at 1.1700 on the hourly chart of EUR/USD.
- USD/JPY is following an ascending channel with support at 0.9930 on the hourly chart.
- The Euro Zone Manufacturing PMI in July 2018 (Preliminary) increased from 54.9 to 55.1.
EUR/USD Technical Analysis
The Euro moved higher this past week above the 1.1700 level against the US Dollar. The EUR/USD pair traded close to the 1.1750 resistance and later started a downward correction.
The pair declined and broke the 1.1700 and 1.1675 support levels. There was also a break below the 38.2% Fib retracement level of the last wave from the 1.1574 low to 1.1750 high.
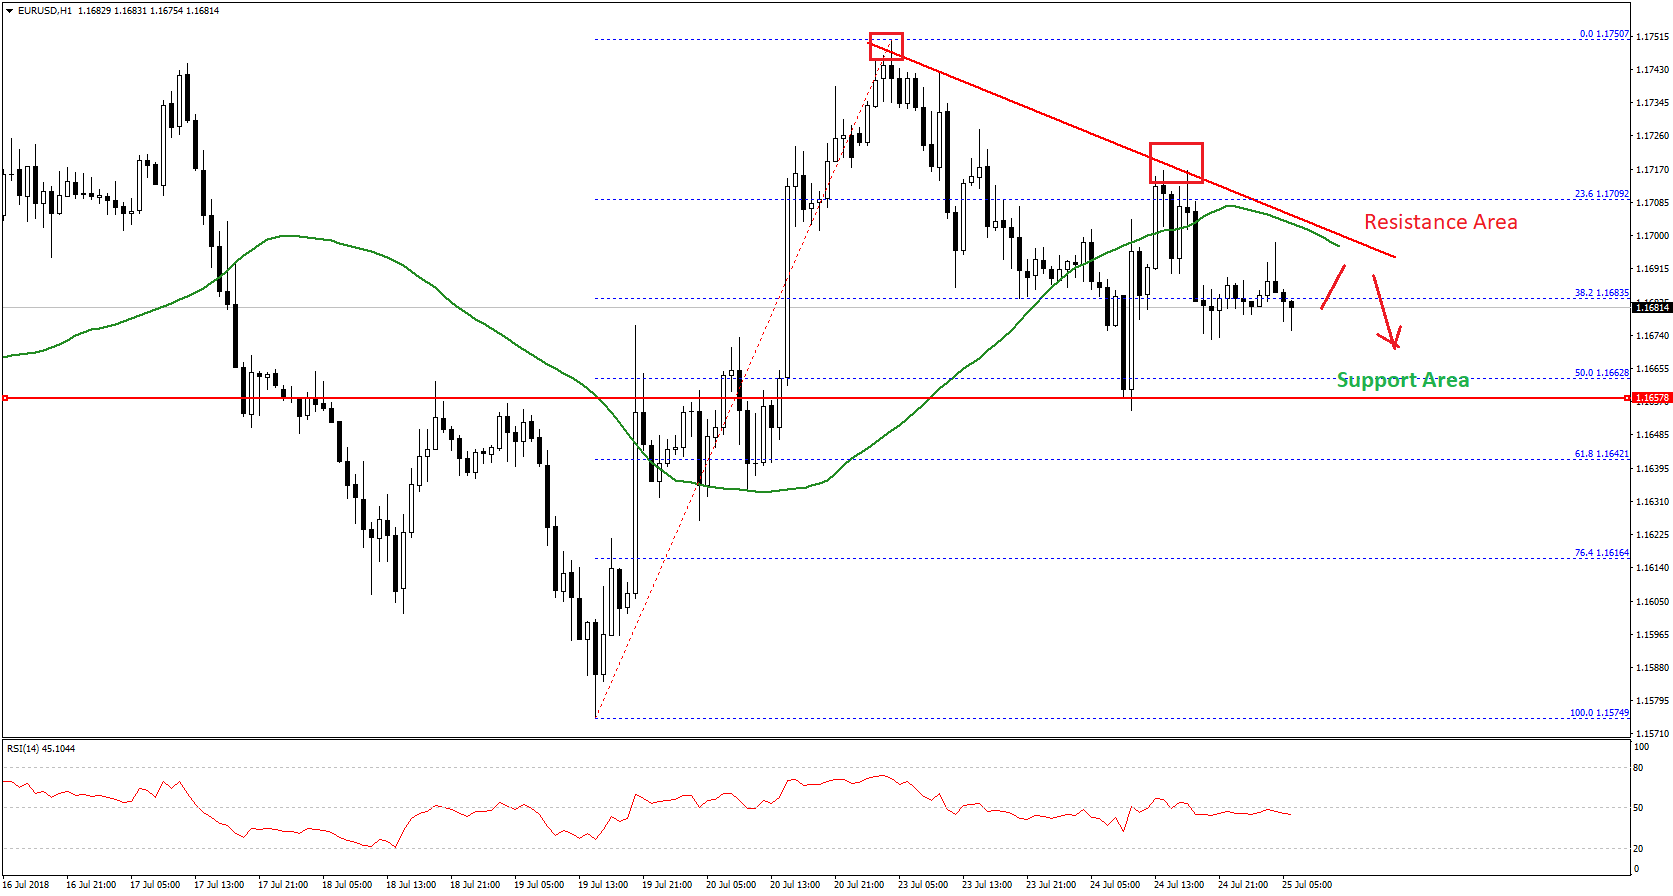
However, losses were protected by the 1.1650 support and the 50% Fib retracement level of the last wave from the 1.1574 low to 1.1750 high. The pair bounced back, but the 50 hourly simple moving average acted as a barrier near the 1.1710 level.
More importantly, there is a bearish trend line is in place with resistance at 1.1700 on the hourly chart. It seems like the pair may perhaps extend the current decline and it could retest the 1.1650 support.
Should there be a break below the 1.1650 support, EUR/USD will most likely retest the 1.1600 level. On the other hand, if the pair breaks the trend line, 1.1700 resistance, and the 50 SMA, then there could be a retest of the 1.1750 resistance. Above this, the next resistance is near the 1.1800 level.
Recently, the Euro Zone Manufacturing PMI reading for July 2018 (Preliminary) was released. The market was looking for a minor decline from the last reading of 54.9 to 54.6.
The result was better than the forecast, as there was a rise in the Euro Zone Manufacturing PMI from 54.9 to 55.1.
USD/CHF Technical Analysis
The US Dollar declined heavily this past week and broke the 0.9960 support area against the Swiss franc. The USD/CHF pair traded close to the 0.9900 level and formed a low at 0.9901.
Later, the pair started an upward correction and moved above the 0.9920 resistance and the 50 hourly SMA. The pair also succeeded in moving above the 23.6% Fib retracement level of the last decline from the 1.0043 high to 0.9901 low.
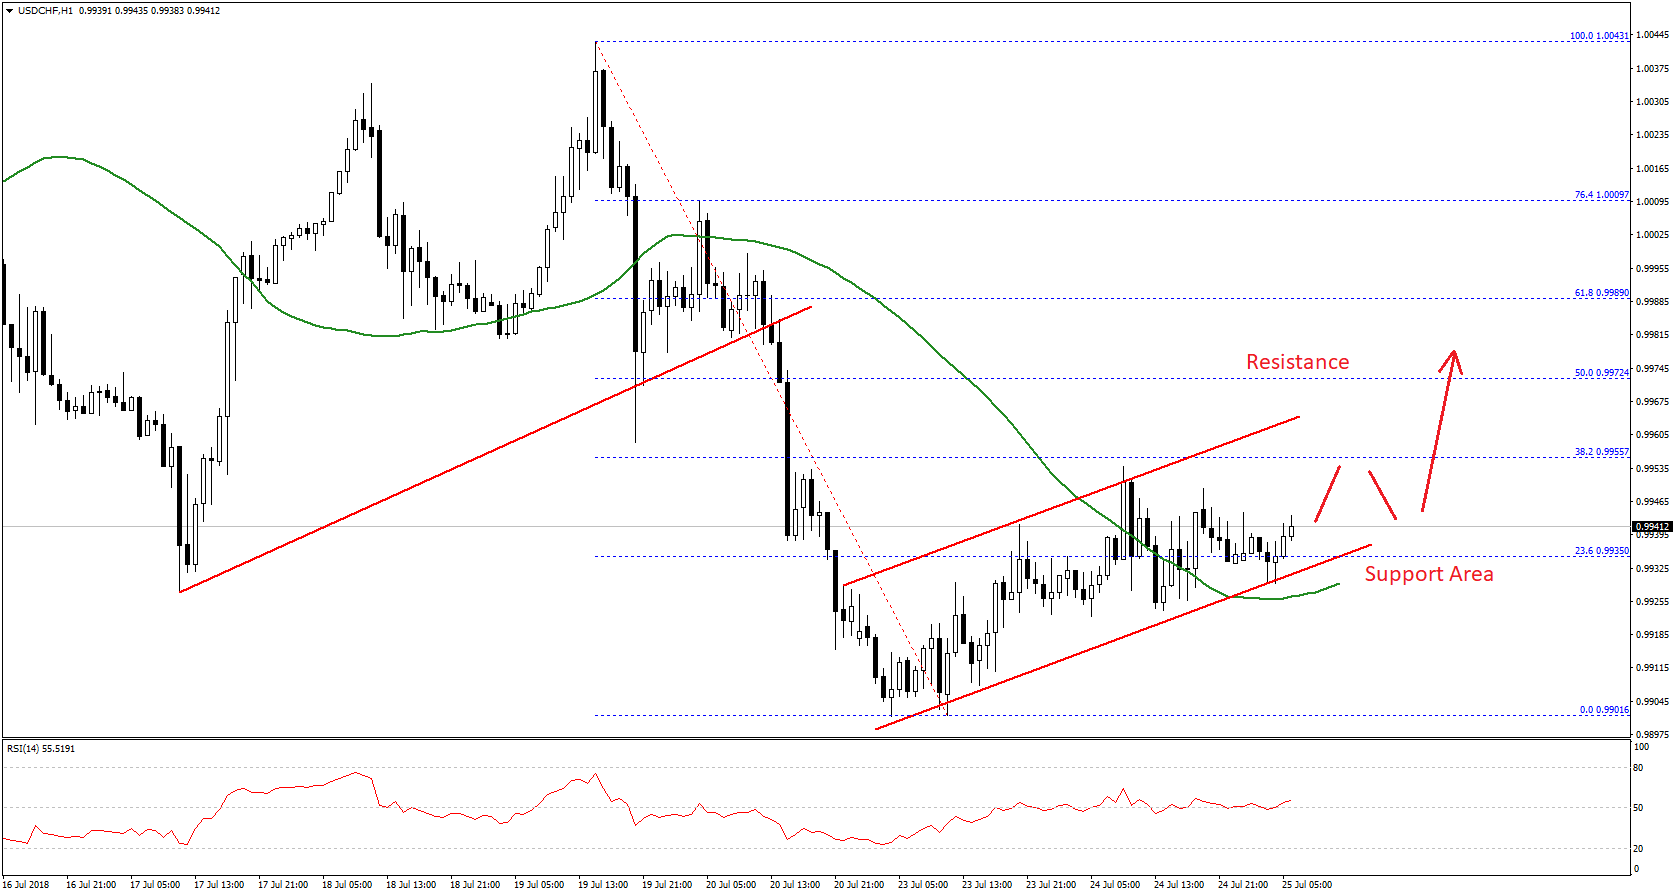
At the moment, it seems like there is an ascending channel forming with support at 0.9930 on the hourly chart. On the upside, a break above the 0.9955/60 resistance area could open the doors for more gains in the near term.
The next resistance may be the 50% Fib retracement level of the last decline from the 1.0043 high to 0.9901 low at 0.9972. On the flip side, if the pair declines and breaks the channel support at 0.9930, it may perhaps move back towards the 0.9900 level.
Below the 0.9900 support, the pair might face a lot of selling pressure. The next supports are near the 0.9880 and 0.9860 levels.
Trade over 50 forex markets 24 hours a day with FXOpen. Take advantage of low commissions, deep liquidity, and spreads from 0.0 pips. Open your FXOpen account now or learn more about trading forex with FXOpen.
This article represents the opinion of the Companies operating under the FXOpen brand only. It is not to be construed as an offer, solicitation, or recommendation with respect to products and services provided by the Companies operating under the FXOpen brand, nor is it to be considered financial advice.
Latest from Forex Analysis
Latest articles

XAU/USD Gold Price Reaches an Important Resistance Zone
The XAU/USD gold chart today indicates that the historical record price of the metal is above USD 2,400 per ounce.
In addition to fears of a new round of inflation due to rising commodity prices, geopolitical tensions are

What Is a Break of Structure and How Can You Trade It?
In the ever-evolving world of Smart Money Concept (SMC) trading, a nuanced understanding of market dynamics is indispensable. This article explores the concept of Break of Structure (BOS), how to identify it, and its implications for trading strategies, setting traders

Hong Kong Stocks Become Top Risers After Wild Ride Subsides
Hong Kong enjoyed a sterling reputation for an entire century as a highly polished, utterly stable mantlepiece upon which global corporations could comfortably sit and where an international talent base could reside in fabulous surroundings and approach European, American, African