


FXOpen
EUR/USD traded with a positive bias and settled above the 1.1640 resistance. USD/JPY is consolidating above the 111.00 support and is preparing for an upside break.
Important Takeaways for EUR/USD and USD/JPY
- The Euro started a nice upside move and traded above the 1.1600 and 1.1640 resistances.
- EUR/USD is trading well above a major bullish trend line with support at 1.1680 on the hourly chart.
- USD/JPY is facing a tough resistance near a bearish trend line at 111.30 on the hourly chart.
- The pair will either break 111.30 and 111.40 for more gains or decline below the 111.00 support.
EUR/USD Technical Analysis
The Euro formed a decent base around the 1.1520 level against the US Dollar, and moved higher. The EUR/USD pair gained bullish momentum and succeeded in clearing an important resistance at 1.1600.
The pair followed a bullish path and cleared the 1.1640 and 1.1680 resistance levels. The pair also broke the 1.1700 resistance and settled above the 50 hourly simple moving average. A fresh weekly high was formed at 1.1733 before the pair started a downside correction.
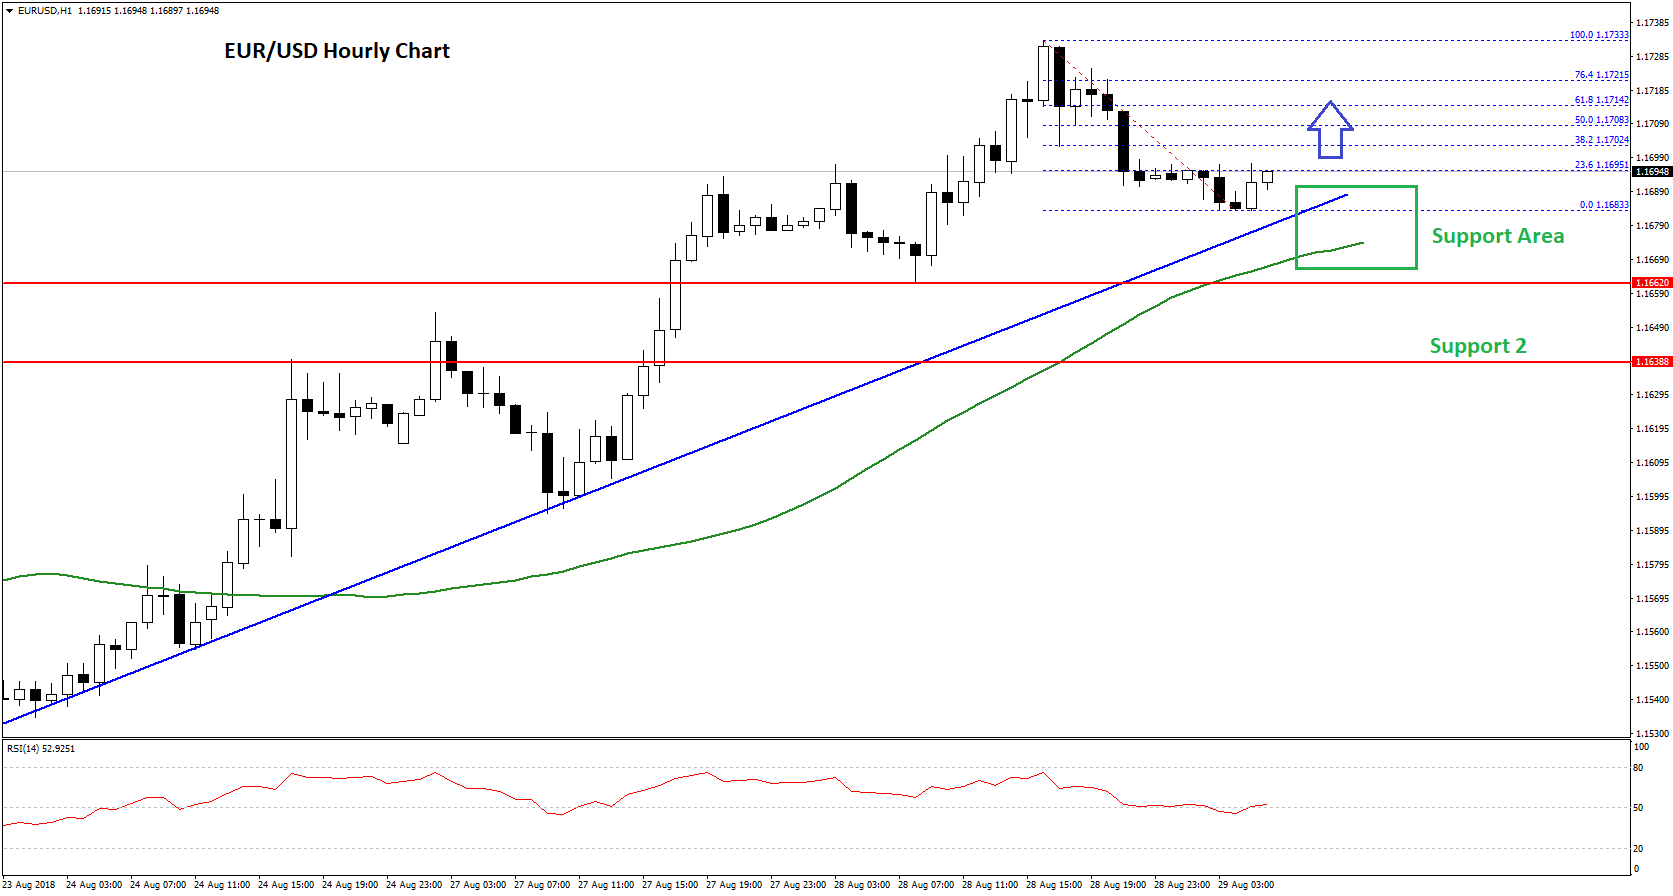
It declined below the 1.1700 support and traded close to the 1.1680 support area. On the downside, there is a major bullish trend line with support at 1.1680 on the hourly chart. Below the trend line, the 50 hourly SMA is positioned near the 1.1675, below which there is a strong support near the 1.1662 level.
It seems like if the pair continues to correct lower, it is likely to find many supports near the 1.1680 and 1.1660 levels. On the upside, an initial resistance is the 23.6% Fib retracement level of the last decline from the 1.1733 high to 1.1683 low.
However, a proper close above the 1.1710 level and the 50% Fib retracement level of the last decline from the 1.1733 high to 1.1683 low is required for a fresh bullish wave above the 1.1730 level in the near term.
Overall, the EUR/USD pair remains well supported above the 1.1660 level and it is likely to resume its upside above 1.1700.
USD/JPY Technical Analysis
The US Dollar remained in a solid uptrend from the 110.00 swing low against the Japanese Yen. The USD/JPY pair traded above the 111.00 resistance and formed a short-term top near the 111.50 level.
There was a downside correction from the 111.48 high and the pair moved below 111.20. There was also a break below the 23.6% Fib retracement level of the last wave from the 109.75 low to 111.48 high.
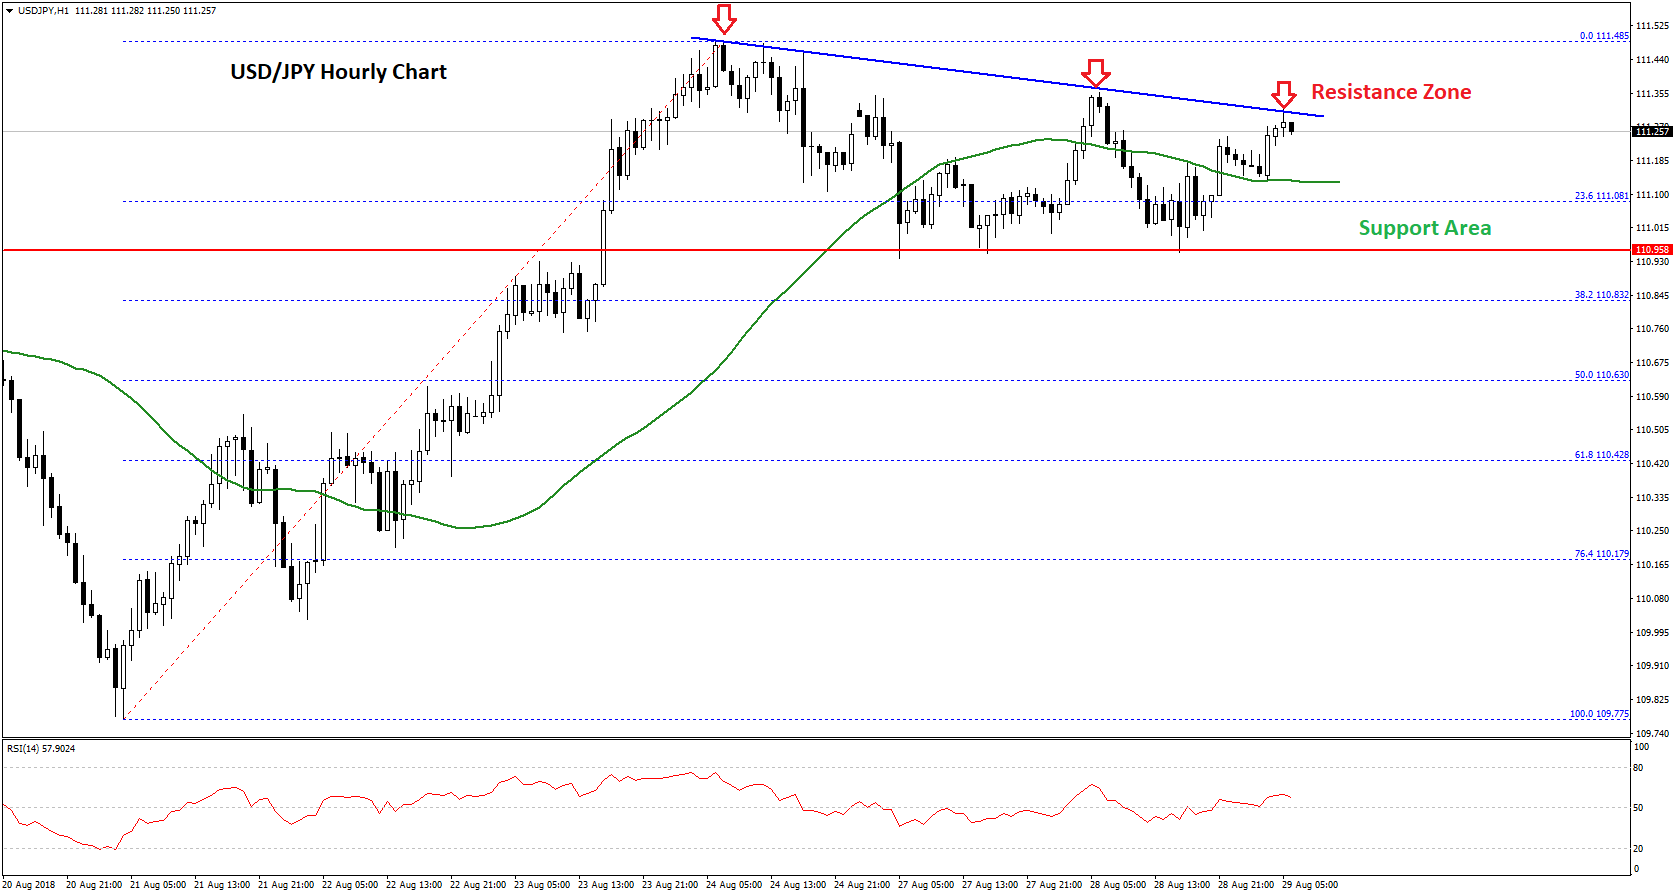
However, downsides were defended near the 110.95 and 111.00 support levels. The pair started consolidating in a range above the 111.00 support and there were a couple of swing moves around the 50 hourly SMA.
On the upside, there is a tough resistance near a bearish trend line at 111.30 on the hourly chart. A proper break and close above the trend line followed by a push above the 111.48 high is needed for more gains in the near term.
The next resistance above 111.50 is near the 112.00 level, above which the pair could test the 112.40 resistance. On the downside, if there is a bearish break below the 111.00 support, the pair could test the 50% Fib retracement level of the last wave from the 109.75 low to 111.48 high at 110.63.
Overall, the USD/JPY pair has to clear the 111.30 and 111.40 resistances for more upsides. If not, there is a risk of a break below 111.00.
Trade over 50 forex markets 24 hours a day with FXOpen. Take advantage of low commissions, deep liquidity, and spreads from 0.0 pips. Open your FXOpen account now or learn more about trading forex with FXOpen.
This article represents the opinion of the Companies operating under the FXOpen brand only. It is not to be construed as an offer, solicitation, or recommendation with respect to products and services provided by the Companies operating under the FXOpen brand, nor is it to be considered financial advice.
Latest from Forex Analysis
Latest articles

What Order Imbalance Is and How To Use It in a Trading Strategy
Understanding the nuances of order imbalances is key for traders looking to navigate the ebb and flow of asset prices. Order imbalances provide a clear window into the supply and demand dynamics at play, offering strategic insights. This article delves

XAU/USD Gold Price Reaches an Important Resistance Zone
The XAU/USD gold chart today indicates that the historical record price of the metal is above USD 2,400 per ounce.
In addition to fears of a new round of inflation due to rising commodity prices, geopolitical tensions are

What Is a Break of Structure and How Can You Trade It?
In the ever-evolving world of Smart Money Concept (SMC) trading, a nuanced understanding of market dynamics is indispensable. This article explores the concept of Break of Structure (BOS), how to identify it, and its implications for trading strategies, setting traders