


FXOpen
EUR/USD recovered recently above 1.1200, but it is facing a crucial resistance near 1.1320. USD/JPY is also approaching a major barrier, which could produce a bearish reaction.
Important Takeaways for EUR/USD and USD/JPY
- The Euro recovered nicely after trading towards the 1.1180 support area.
- There is a major contracting triangle in place with resistance at 1.1300 on the hourly chart of EUR/USD.
- USD/JPY corrected higher after trading close to the 110.80 support area.
- There is a crucial contracting triangle formed with resistance at 111.30 on the hourly chart.
EUR/USD Technical Analysis
The Euro fell significantly this past week from well above the 1.1380 level against the US Dollar. The EUR/USD pair even broke the 1.1240 support level and traded close to the 1.1165 support level.
There was a sharp decline towards 1.1165 and the pair traded as low as 1.1176 on FXOpen. Later, the pair started a slow and steady rise and recovered above the 1.1220 and 1.1240 resistance levels.
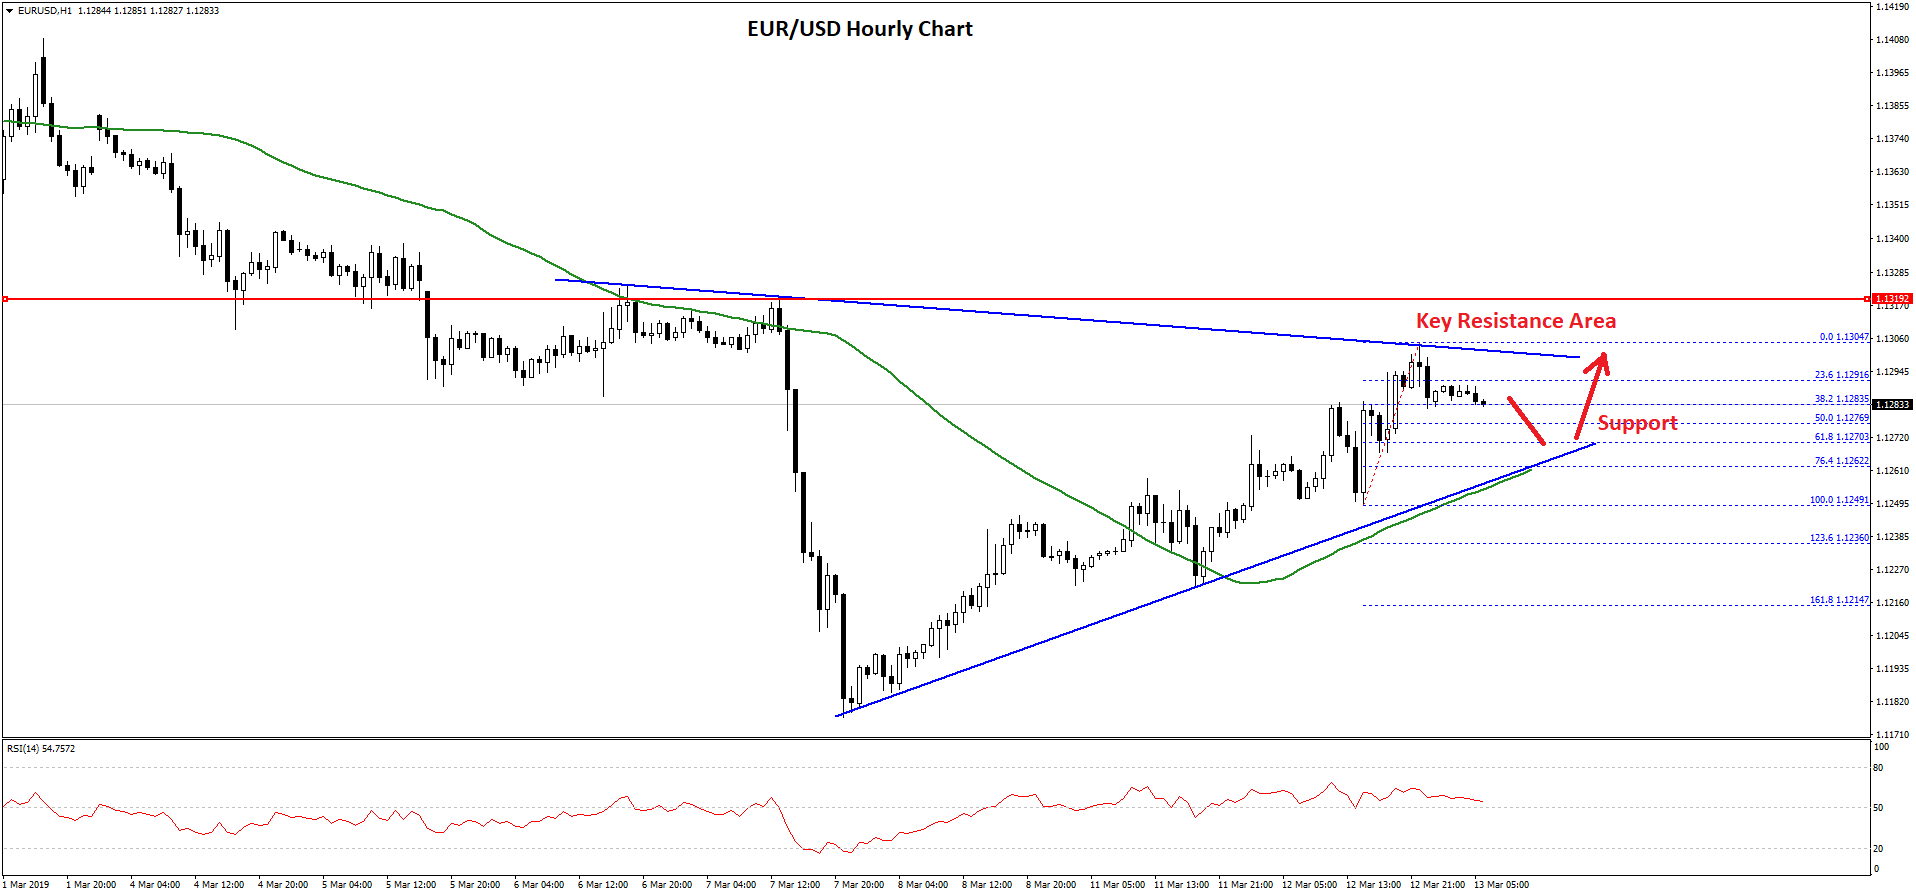
There was also a close above the 1.1240 level and the 50 hourly simple moving average. The pair formed a swing low at 1.1249 and it recently traded as high as 1.1304. Later, there was a downside correction and the price declined below 1.1290.
It is currently trading near the 38.2% Fib retracement level of the recent wave from the 1.1249 low to 1.1304 high. To the downside, there are many supports near the 1.1270 level.
More importantly, there is a major contracting triangle in place with resistance at 1.1300 on the hourly chart of EUR/USD. Therefore, the pair could soon make the next move either above the 1.1305 resistance area or decline below the 1.1270 support and the 50% Fib retracement level of the recent wave from the 1.1249 low to 1.1304 high.
On the upside, a break above the 1.1305 and 1.1320 is needed for more gains. On the downside, a break below 1.1270 could push the price towards the 1.1235 and 1.1210 support levels.
USD/JPY Technical Analysis
The US Dollar faced a strong selling interest near the 112.10 level against the Japanese Yen. The USD/JPY pair started a downside move below the 111.80 and 111.50 support levels to move into a bearish zone.
It even broke the 111.00 support and traded as low as 110.79. Later, it recovered nicely above the 111.00 resistance and the 50 hourly simple moving average. There was a break above the 50% Fib retracement level of the last decline from the 111.85 high to 110.79 low.
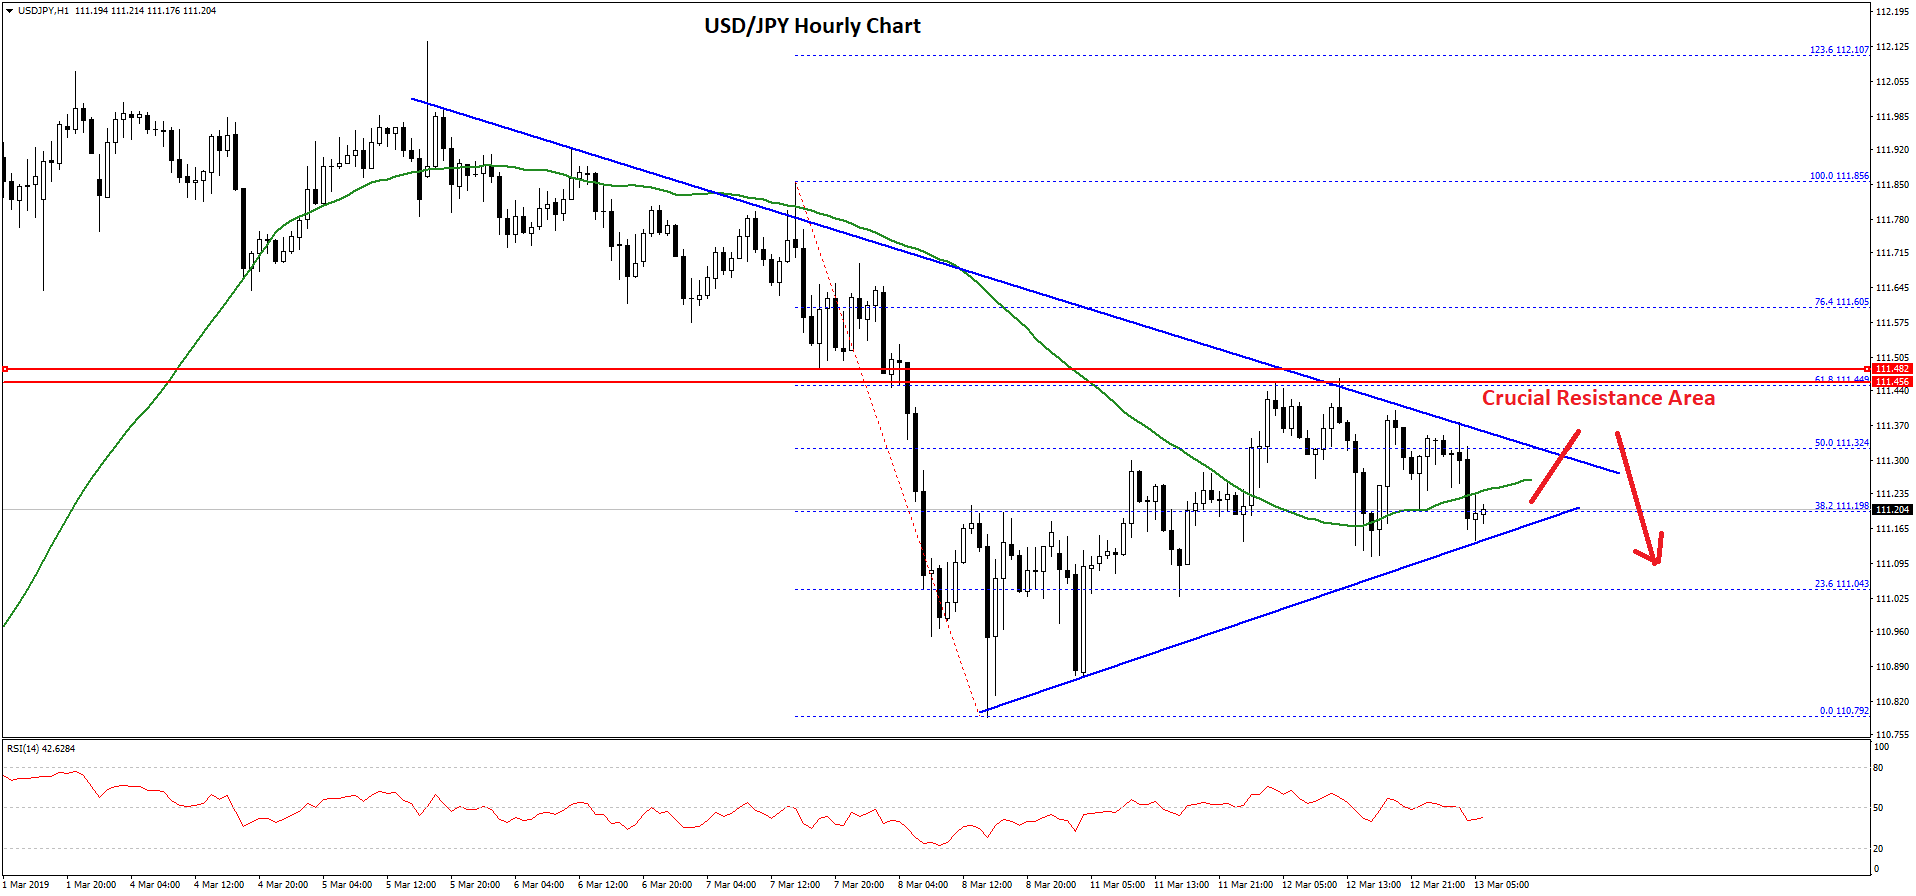
However, the previous support area near the 111.50 level acted as a strong barrier for buyers. Besides, the 61.8% Fib retracement level of the last decline from the 111.85 high to 110.79 low acted as a resistance.
At the outset, there is a crucial contracting triangle formed with resistance at 111.30 on the hourly chart. Therefore, the pair may soon make the next move either above the 111.50 resistance or below the 111.20 support level in the near term.
If there is an upside break above the 111.30 and 111.50 resistances, the pair could rise towards the 112.00 level. On the other hand, a break below 111.15 and 111.10 may push the pair back towards the 110.80 support.
Trade over 50 forex markets 24 hours a day with FXOpen. Take advantage of low commissions, deep liquidity, and spreads from 0.0 pips. Open your FXOpen account now or learn more about trading forex with FXOpen.
This article represents the opinion of the Companies operating under the FXOpen brand only. It is not to be construed as an offer, solicitation, or recommendation with respect to products and services provided by the Companies operating under the FXOpen brand, nor is it to be considered financial advice.
Latest from Forex Analysis
Latest articles

Weekly Market Wrap With Gary Thomson: UK100, USD, GOLD, OIL
Get the latest scoop on the week's hottest headlines, all in one convenient video. Join Gary Thomson, the COO of FXOpen UK, as he breaks down the most significant news reports and shares his expert insights.
- UK100 Share Index Rises

What Is a Darvas Box Theory and How Does It Work in Trading?
The Darvas Box Theory, pioneered by Nicolas Darvas in the 1950s, has transcended its stock market origins to become a valuable tool for forex traders. This method leverages specific price movements and patterns, known as the Darvas Box, to track

NFLX Stock Price Falls Despite Subscriber Growth
Yesterday, after the close of the main trading session on the stock market, Netflix reported to investors for the 1st quarter of 2024.
The report turned out better than expected:
→ earnings per share: actual = USD 5.28, forecast = USD 4.