


FXOpen

EUR/USD corrected higher above 1.1000, but it is facing many important resistances near 1.1025. Similarly, USD/JPY is approaching towards the 107.50 resistance area.
Important Takeaways for EUR/USD and USD/JPY
- The Euro started an upside correction after it traded to a new weekly low at 1.0965.
- There is a major bearish trend line forming with resistance near 1.1045 on the hourly chart of EUR/USD.
- USD/JPY is also correcting higher from the 106.95 swing low and is trading above 107.20.
- There is a key bearish trend line forming with resistance near 107.50 on the hourly chart.
EUR/USD Technical Analysis
There were mostly bearish moves in the Euro in the past few days below 1.1050 against the US Dollar. The EUR/USD pair followed a bearish path and even broke the 1.1000 support area.
Moreover, there was a close below the 1.1000 level and the 50 hourly simple moving average. The pair traded to a new weekly low at 1.0965 on FXOpen and recently started an upside correction.
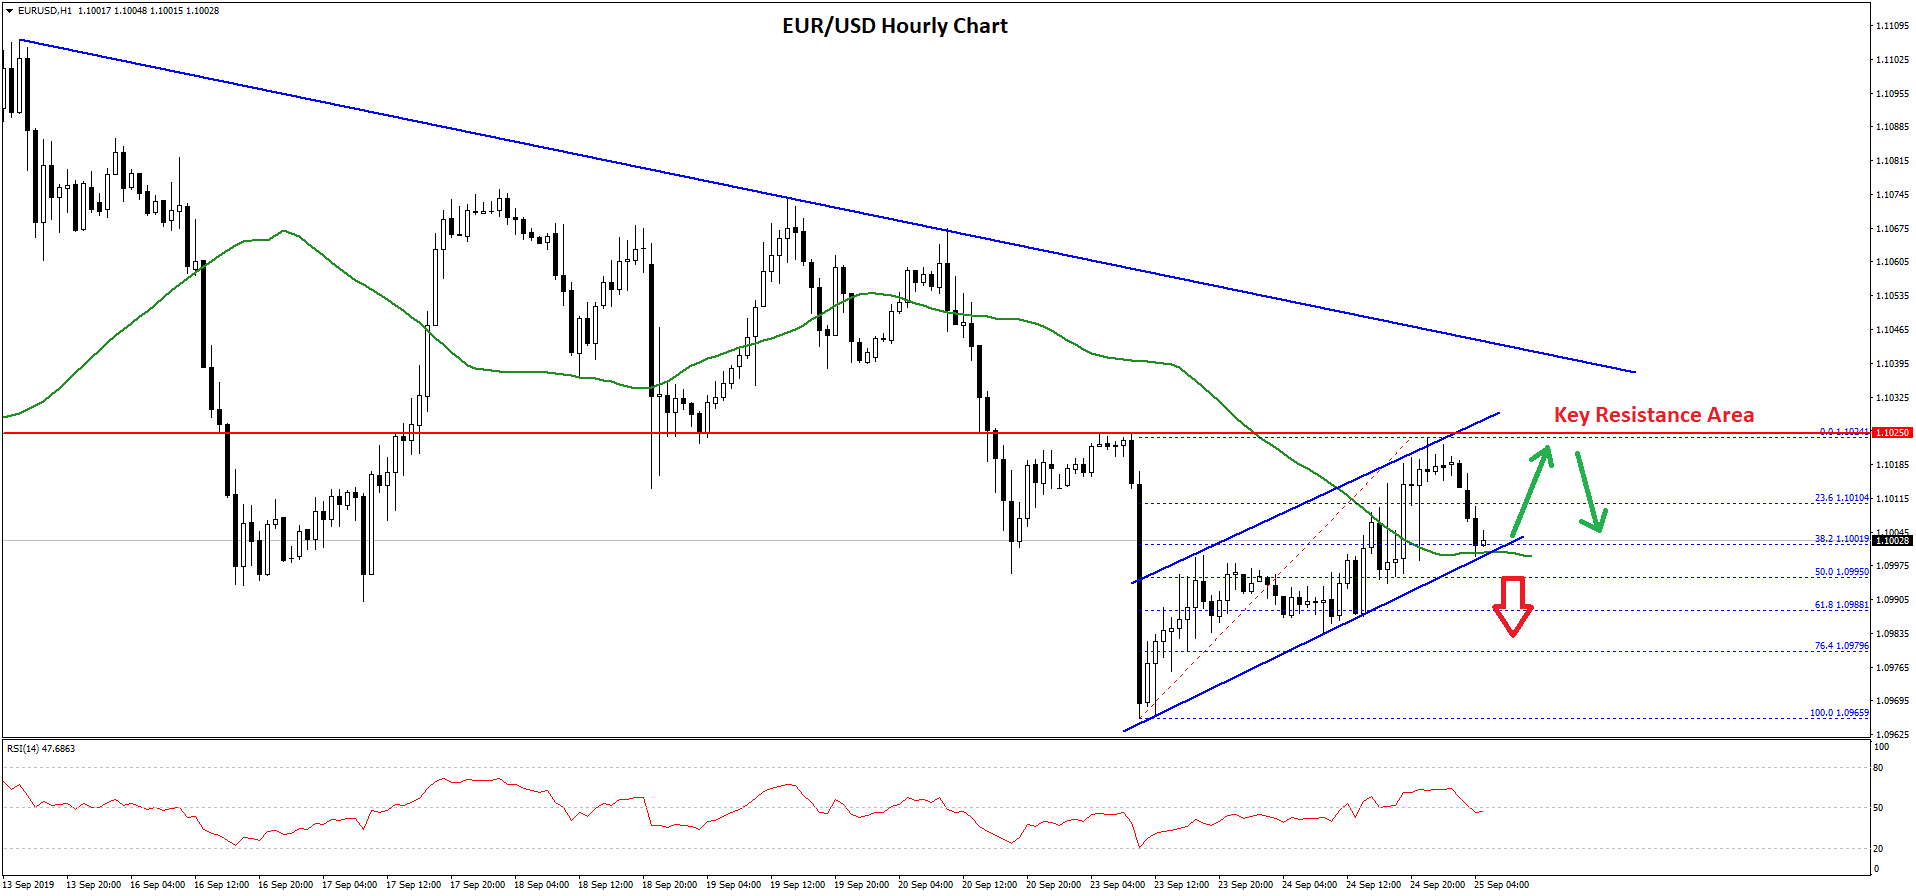
It corrected above the 1.0980 and 1.1000 levels. However, the previous support near the 1.1025 level acted as a strong resistance. As a result, the pair is currently declining and is trading below 1.1010.
There was a break below the 23.6% Fib retracement level of the upward move from the 1.0965 swing low to 1.1024 high. At the moment, the pair is testing an important support near the 1.1000 level and the 50 hourly simple moving average.
Moreover, there is an ascending channel in place with support at 1.1000 on the hourly chart. If there is a downside break below the channel support, the pair could resume its decline. An immediate support is near 1.0995 and the 50% Fib retracement level of the upward move from the 1.0965 swing low to 1.1024 high.
Any further losses might push the price back towards the 1.0965 low. On the upside, there are many important resistances near 1.1025 and 1.1040. There is also a major bearish trend line forming with resistance near 1.1045 on the hourly chart.
Therefore, EUR/USD must surpass 1.1025 and 1.1045 to move into a positive zone. If not, it could slide back to 1.0965.
USD/JPY Technical Analysis
In the past few days, the US Dollar declined steadily from the 108.40 resistance against the Japanese Yen. The USD/JPY pair broke the 108.00 and 107.50 support levels to move into a bearish zone.
Moreover, there was a close below the 107.50 level and the 50 hourly simple moving average. The pair traded as low as 106.95 and it recently started an upside correction.
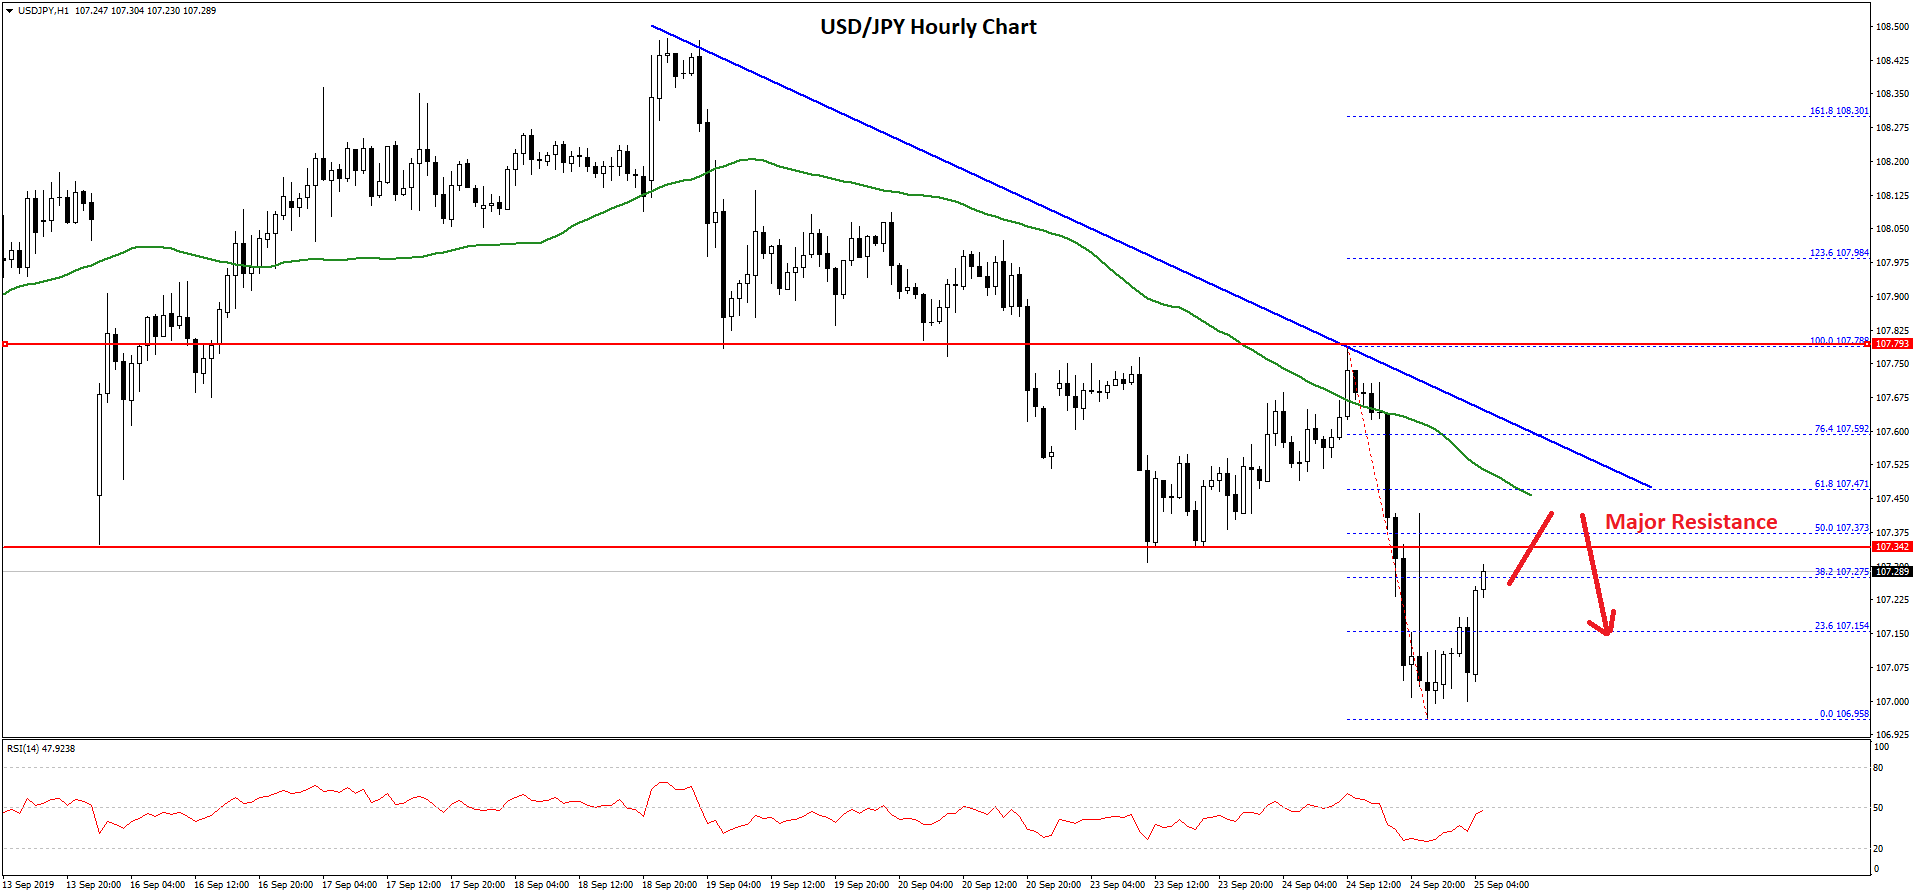
There was a break above the 107.20 level and the 38.2% Fib retracement level of the last decline from the 107.78 high to 106.95 low. However, the pair is approaching a couple of important resistances near the 107.40 level.
The 50% Fib retracement level of the last decline from the 107.78 high to 106.95 low is also near 107.37 to act as a resistance. Additionally, there is a key bearish trend line forming with resistance near 107.50 on the hourly chart.
If there is an upside break above 107.40 and 107.50, the pair could start a fresh increase towards the 108.00 level. Conversely, if the pair fails to climb above 107.50, it could resume its decline below the 107.00 support.
Trade over 50 forex markets 24 hours a day with FXOpen. Take advantage of low commissions, deep liquidity, and spreads from 0.0 pips. Open your FXOpen account now or learn more about trading forex with FXOpen.
This article represents the opinion of the Companies operating under the FXOpen brand only. It is not to be construed as an offer, solicitation, or recommendation with respect to products and services provided by the Companies operating under the FXOpen brand, nor is it to be considered financial advice.
Latest from Forex Analysis
Latest articles

What Order Imbalance Is and How To Use It in a Trading Strategy
Understanding the nuances of order imbalances is key for traders looking to navigate the ebb and flow of asset prices. Order imbalances provide a clear window into the supply and demand dynamics at play, offering strategic insights. This article delves

XAU/USD Gold Price Reaches an Important Resistance Zone
The XAU/USD gold chart today indicates that the historical record price of the metal is above USD 2,400 per ounce.
In addition to fears of a new round of inflation due to rising commodity prices, geopolitical tensions are

What Is a Break of Structure and How Can You Trade It?
In the ever-evolving world of Smart Money Concept (SMC) trading, a nuanced understanding of market dynamics is indispensable. This article explores the concept of Break of Structure (BOS), how to identify it, and its implications for trading strategies, setting traders