


FXOpen
EUR/USD declined heavily recently below the 1.1340 and 1.1280 support levels. USD/JPY broke the key 110.25 resistance area to move into a positive zone.
Important Takeaways for EUR/USD and USD/JPY
- The Euro faced an increase in selling pressure and broke the 1.1340 support area.
- There is a crucial bearish trend line in place with resistance at 1.1285 on the hourly chart of EUR/USD.
- USD/JPY formed a solid support base near 109.70 and later corrected higher.
- There was a break above two bearish trend lines with resistance near 110.30 on the hourly chart.
EUR/USD Technical Analysis
The Euro rallied recently towards the 1.1450 resistance level against the US Dollar. The EUR/USD pair faced a strong selling interest, resulting in a sharp decline below the 1.1400 and 1.1340 support levels.
Sellers took control and pushed the pair below the 1.1300 support and the 50 hourly simple moving average. There was even a break below the key 1.1280 support level and the pair traded to a new weekly low at 1.1250 on FXOpen.
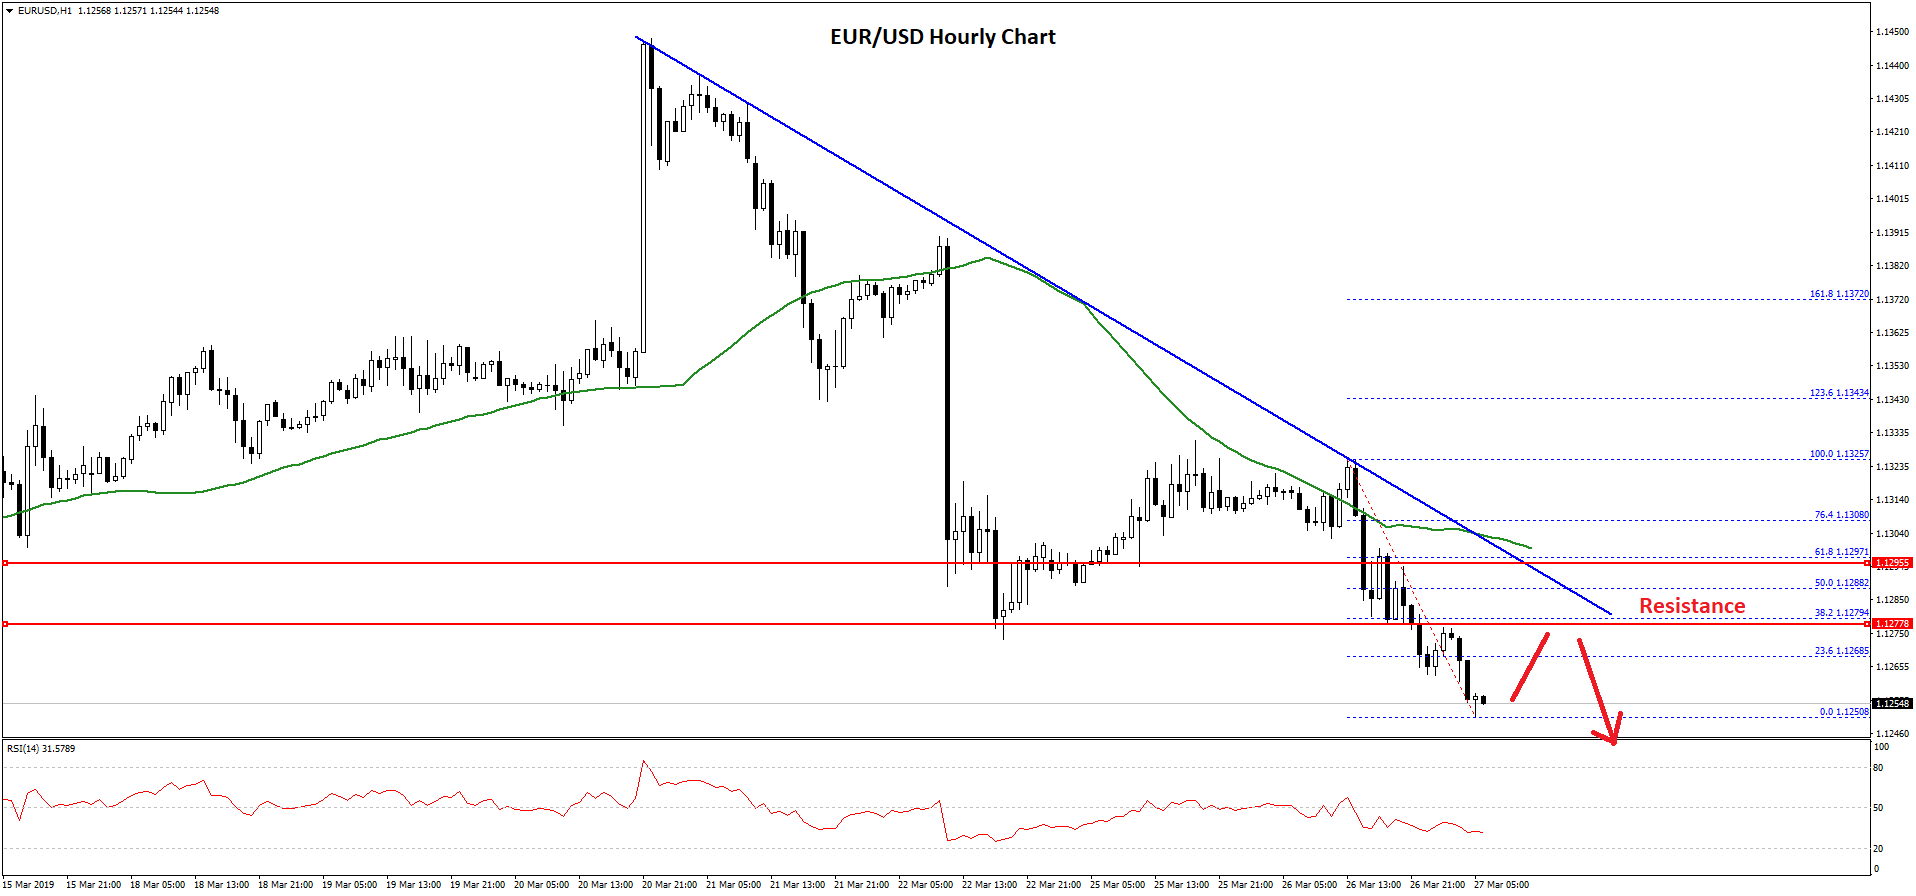
At the moment, the pair seems to be trading in a strong downtrend below 1.1300 and the 50 hourly simple moving average. An initial resistance is near the 1.1270 and the 23.6% Fib retracement level of the recent decline from the 1.1325 high to 1.1250 low.
There is also a crucial bearish trend line in place with resistance at 1.1285 on the hourly chart of EUR/USD. The trend line coincides with the 50% Fib retracement level of the recent decline from the 1.1325 high to 1.1250 low.
Therefore, if the pair corrects higher in the short term, it could face a strong selling interest near the 1.1270 and 1.1285 resistance levels.
On the downside, an initial support is near the 1.1250 level. If there are more losses, the pair might decline heavily towards the 1.1220 or 1.1200 support level in the coming sessions.
USD/JPY Technical Analysis
After a strong decline, the US Dollar found support near the 109.70 level against the Japanese Yen. The USD/JPY pair traded as low as 109.71 and later started a decent upward move.
There was a decent upward move above the 110.00 resistance and the 50 hourly simple moving average. Moreover, there was a break above the 50% Fib retracement level of the last decline from the 110.95 high to 109.71 low.
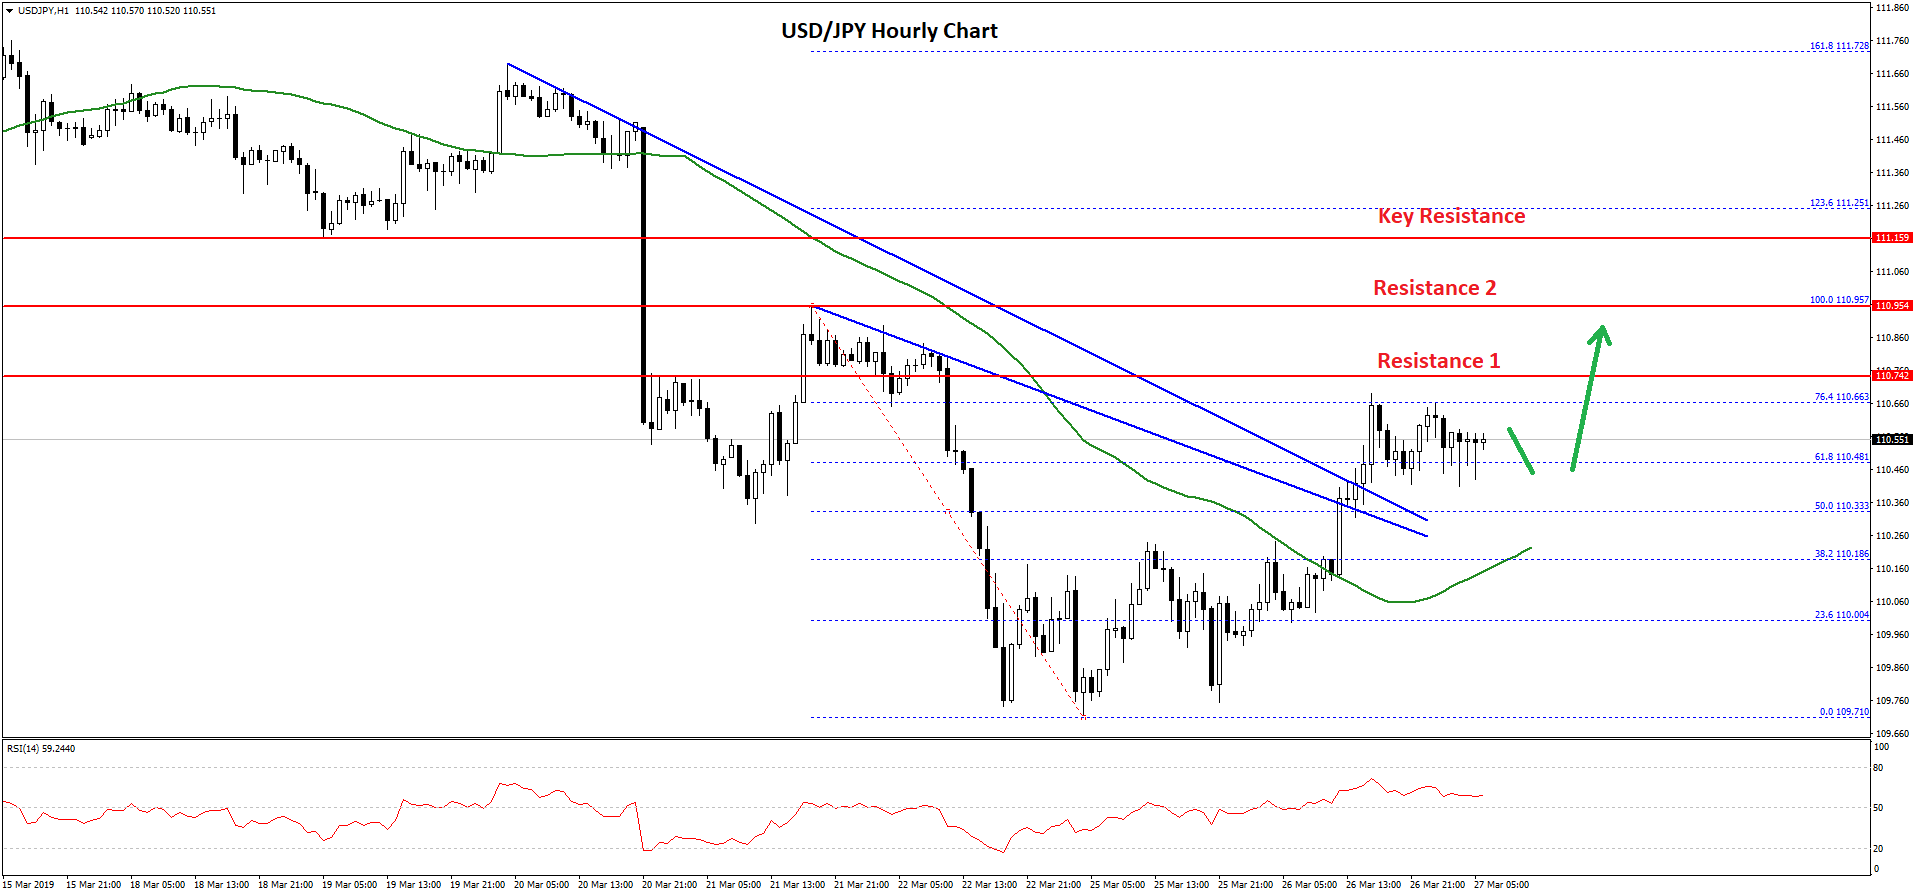
Besides, there was a break above two bearish trend lines with resistance near 110.30 on the hourly chart. It has opened the doors for more gains above the 61.8% Fib retracement level of the last decline from the 110.95 high to 109.71 low.
The current price action is positive above the 110.40 level. An immediate resistance is near the 110.75 level, above which the pair could gain traction above the 111.00 level in the near term.
The next key resistance is near the 111.15 and 111.25 levels. On the downside, if there is a downside correction, the pair might find support near 110.30 level. Besides, the main support is near the 110.25 level and the 50 hourly simple moving average, where buyers are likely to emerge.
Trade over 50 forex markets 24 hours a day with FXOpen. Take advantage of low commissions, deep liquidity, and spreads from 0.0 pips. Open your FXOpen account now or learn more about trading forex with FXOpen.
This article represents the opinion of the Companies operating under the FXOpen brand only. It is not to be construed as an offer, solicitation, or recommendation with respect to products and services provided by the Companies operating under the FXOpen brand, nor is it to be considered financial advice.
Latest from Forex Analysis
Latest articles

Weekly Market Wrap With Gary Thomson: UK100, USD, GOLD, OIL
Get the latest scoop on the week's hottest headlines, all in one convenient video. Join Gary Thomson, the COO of FXOpen UK, as he breaks down the most significant news reports and shares his expert insights.
- UK100 Share Index Rises

What Is a Darvas Box Theory and How Does It Work in Trading?
The Darvas Box Theory, pioneered by Nicolas Darvas in the 1950s, has transcended its stock market origins to become a valuable tool for forex traders. This method leverages specific price movements and patterns, known as the Darvas Box, to track

NFLX Stock Price Falls Despite Subscriber Growth
Yesterday, after the close of the main trading session on the stock market, Netflix reported to investors for the 1st quarter of 2024.
The report turned out better than expected:
→ earnings per share: actual = USD 5.28, forecast = USD 4.