


FXOpen
EUR/USD is currently struggling to stay above 1.1140 and it could decline in the near term. Similarly, USD/JPY is showing bearish signs below the 109.60 resistance area.
Important Takeaways for EUR/USD and USD/JPY
- The Euro is slowly declining after it failed to clear the 1.1200 resistance area.
- There was a break below a contracting triangle with support near 1.1140 on the hourly chart of EUR/USD.
- USD/JPY is facing a strong resistance near the 109.60 and 109.70 levels.
- There is a major bullish trend line in place with support near 109.40 on the hourly chart.
EUR/USD Technical Analysis
This past week, the Euro recovered nicely above 1.1120 resistance area against the US Dollar. As a result, the EUR/USD pair surpassed the 1.1160 resistance, but it struggled to climb above the 1.1200 hurdle.
The pair started a downside correction below 1.1160 and tested the 1.1120 support. Later, it recovered, but struggled near 1.1175. The recent high was formed near 1.1174 on FXOpen and the price is currently declining.
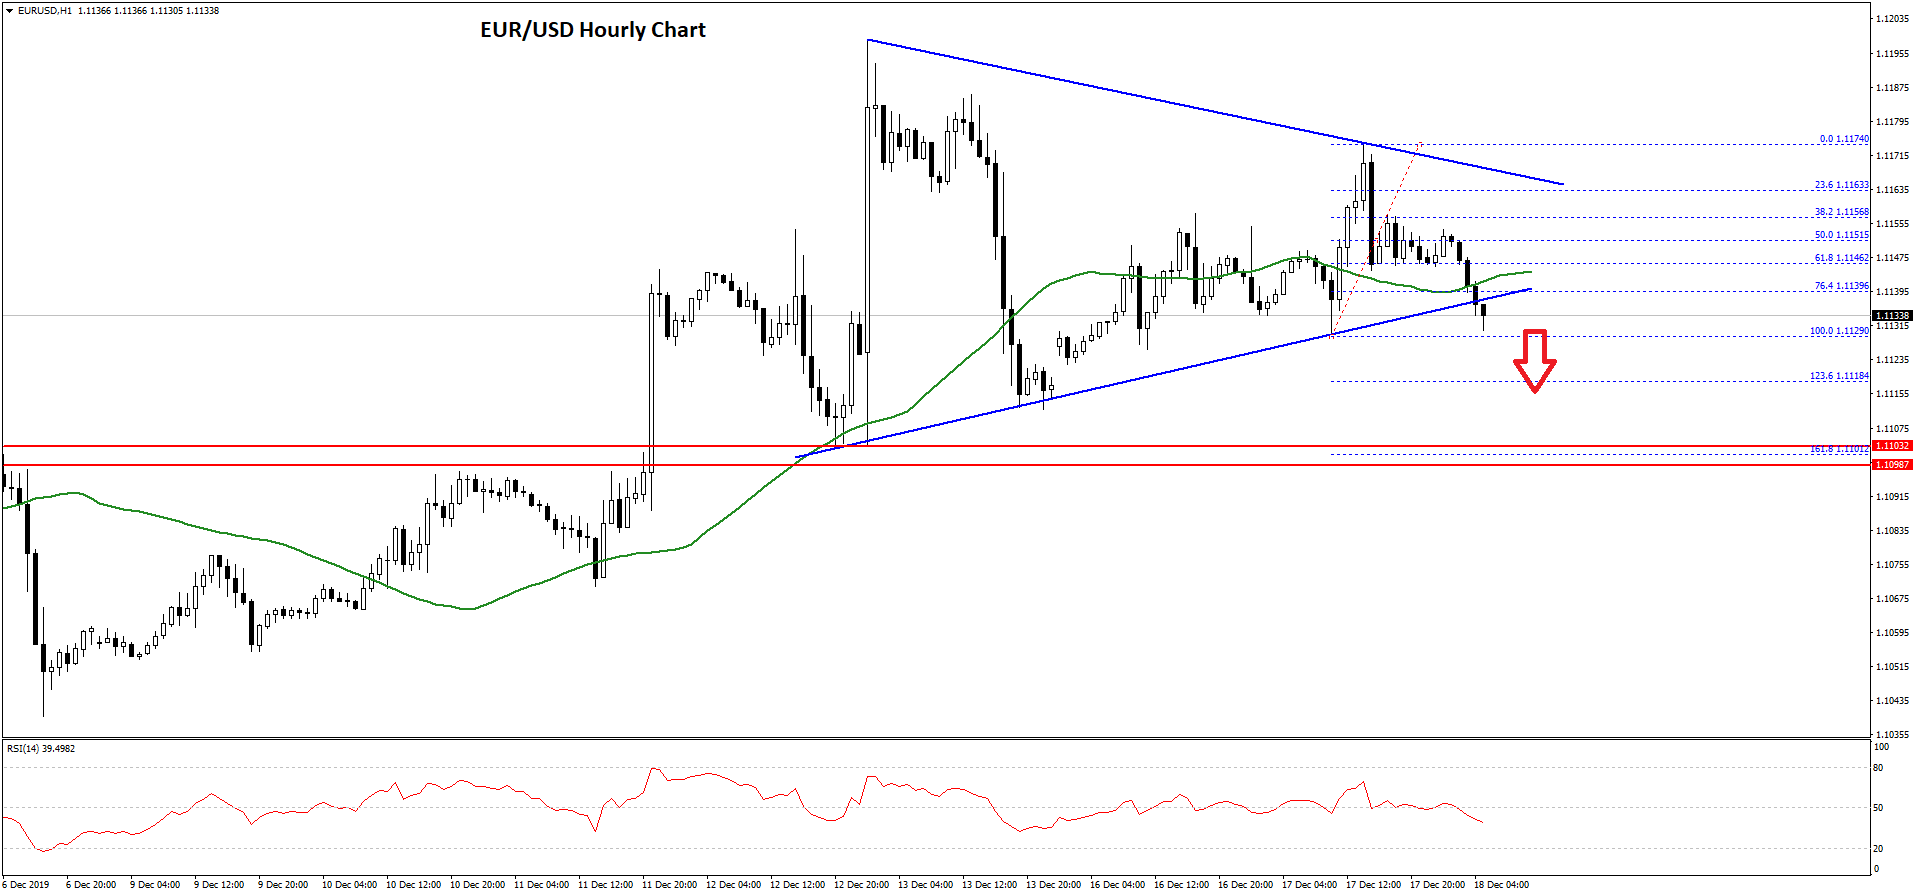
The pair broke the 1.1150 support and the 50 hourly simple moving average. Furthermore, the pair traded below 50% Fib retracement level of the upward move from the 1.1129 low to 1.1174 high.
More importantly, there was a break below a contracting triangle with support near 1.1140 on the hourly chart of EUR/USD. The pair is now trading below the 1.1140 level and the 76.4% Fib retracement level of the upward move from the 1.1129 low to 1.1174 high.
Therefore, it will most likely test the 1.1129 low and it could even trade further lower. The next support might be near the 1.1100 area.
Besides, the 1.618 Fib extension level of the upward move from the 1.1129 low to 1.1174 high is also near 1.1100. Thus, EUR/USD is likely to find support near 1.1100.
On the upside, an initial resistance is near the 1.1145 and 1.1150 levels. If there is a break above 1.1150, the pair could make another attempt to surpass 1.1175.
USD/JPY Technical Analysis
The US Dollar climbed higher nicely from the 108.50 support area against the Japanese Yen. As a result, the USD/JPY pair surged above the 109.00 and 109.20 resistance levels.
The pair even settled above 109.20 and the 50 hourly simple moving average. However, it struggled to gain pace above the 109.60 and 109.70 resistance levels.
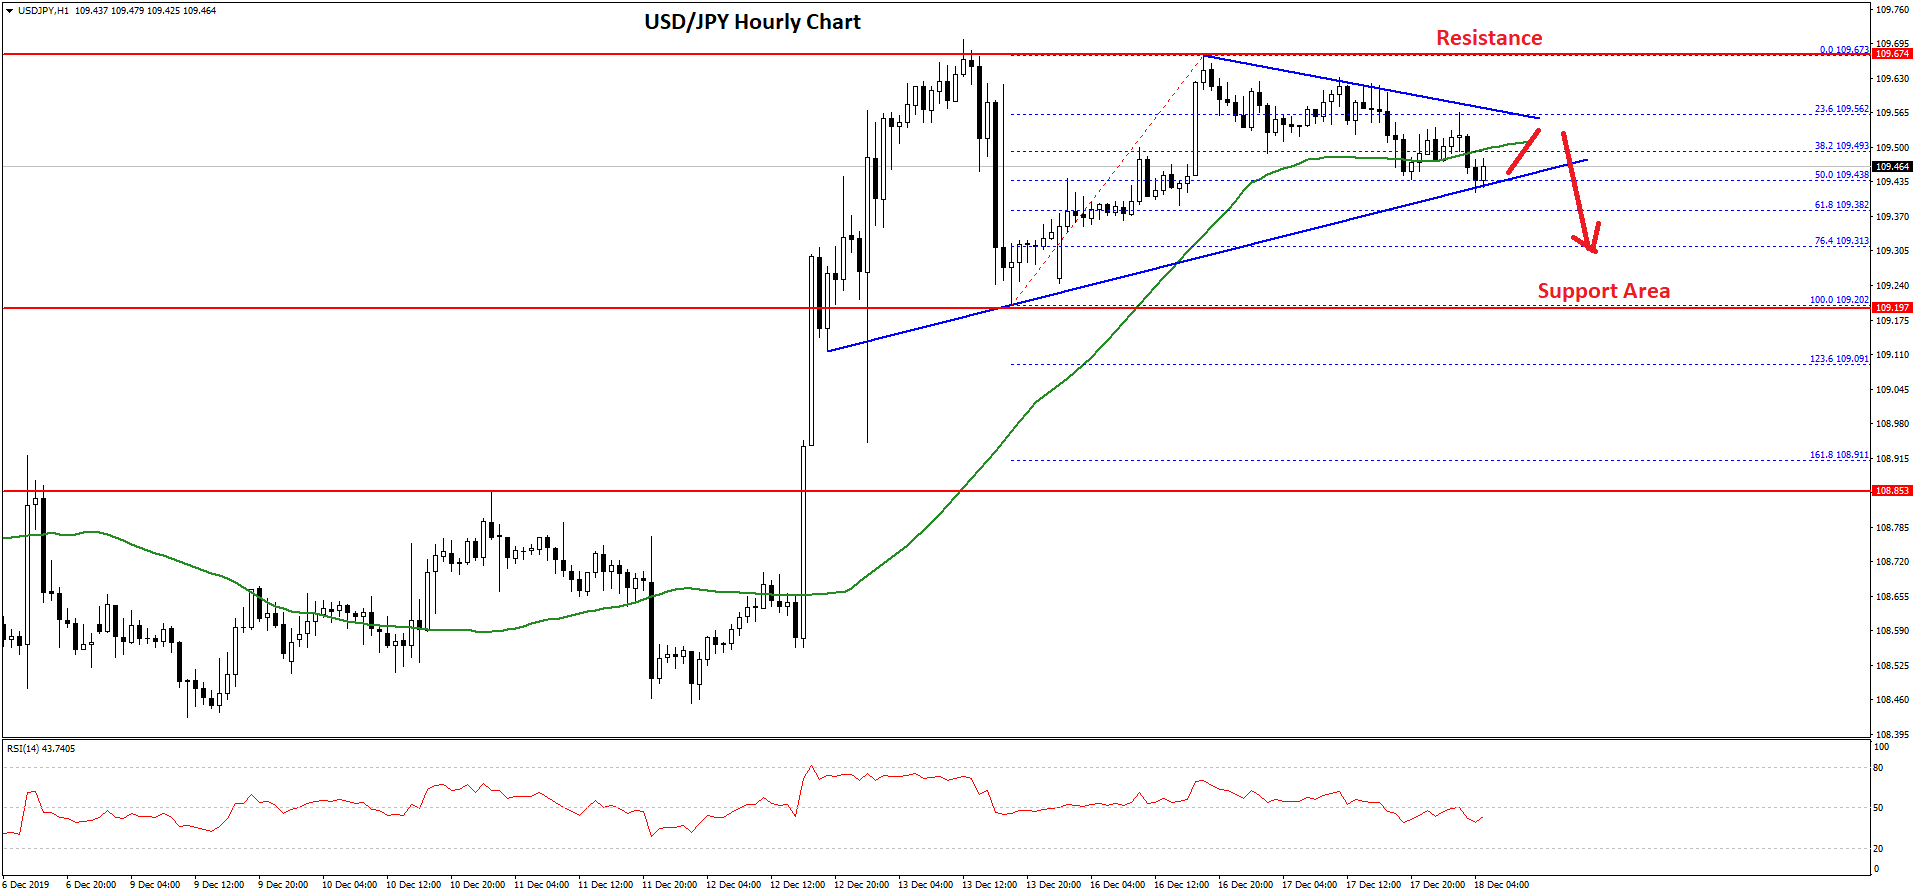
A high was formed near 109.67 and the pair is currently correcting lower. It is testing the 50% Fib retracement level of the upward move from the 109.20 low to 109.67 high.
Moreover, there is a major bullish trend line in place with support near 109.40 on the hourly chart. Therefore, a downside break below 109.40 could push the pair towards the 109.20 support.
An intermediate support might be near the 76.4% Fib retracement level of the upward move from the 109.20 low to 109.67 high. If the pair struggles to stay above 109.20, it could start a fresh decline towards the 108.50 level.
On the upside, an initial resistance is near the triangle area at 109.55. However, the main resistance is still near the 109.60 and 109.70 levels. If there is a clear break above 109.70, USD/JPY could even surpass 110.00 in the near term.
Trade over 50 forex markets 24 hours a day with FXOpen. Take advantage of low commissions, deep liquidity, and spreads from 0.0 pips. Open your FXOpen account now or learn more about trading forex with FXOpen.
This article represents the opinion of the Companies operating under the FXOpen brand only. It is not to be construed as an offer, solicitation, or recommendation with respect to products and services provided by the Companies operating under the FXOpen brand, nor is it to be considered financial advice.
Latest from Forex Analysis
Latest articles

Google Share Price Rose Post-market to a New All-time Record
Yesterday, after the close of the main trading session, a report on activities for the 1st quarter of Alphabet Inc. (Google's parent company) was published. The report was strong, exceeding investors' expectations.
→ Quarterly EPS = USD 1.89 (expected = USD 1.

S&P 500 Rebounds after Negative GDP News
Data released yesterday showed US GDP growth slowed to 1.6% in the first quarter of the year. According to ForexFactory: forecast = 2.2%, past value = 2.4%.
Reaction to the news sent the S&P 500 mini stock

GBP/USD And USD/CAD Daily Chart Outlook
GBP/USD is attempting a recovery wave from 1.2300. USD/CAD is consolidating and might aim for a move above the 1.3760 resistance zone.
Important Takeaways for GBP/USD and USD/CAD Analysis Today
· The British Pound started