


FXOpen
EUR/USD retested the 1.1300-1.1310 support area and later started a decent recovery. USD/CHF climbed higher recently and dips remain supported near 0.9900 in the short term.
Important Takeaways for EUR/USD and USD/CHF
- The Euro declined heavily recently and tested the key 1.1300 support area against the US Dollar.
- There was a break below a key bullish trend line with support at 1.1340 on the hourly chart of EUR/USD.
- USD/CHF recovered recently and broke the 0.9890 and 0.9900 resistance levels.
- The pair is currently struggling to break a bearish trend line with resistance at 0.9930 on the hourly chart.
EUR/USD Technical Analysis
The Euro started a major downside move from the 1.1450 resistance area against the US Dollar. The EUR/USD pair declined and traded below the 1.1400, 1.1380 and 1.1350 support levels.
The pair even broke the 1.1320 support level plus the 50 hourly simple moving average, and traded as low as 1.1306 on FXOpen. Later, the pair formed a decent support near the 1.1300-1.1310 zone and finally started a short term upside correction.
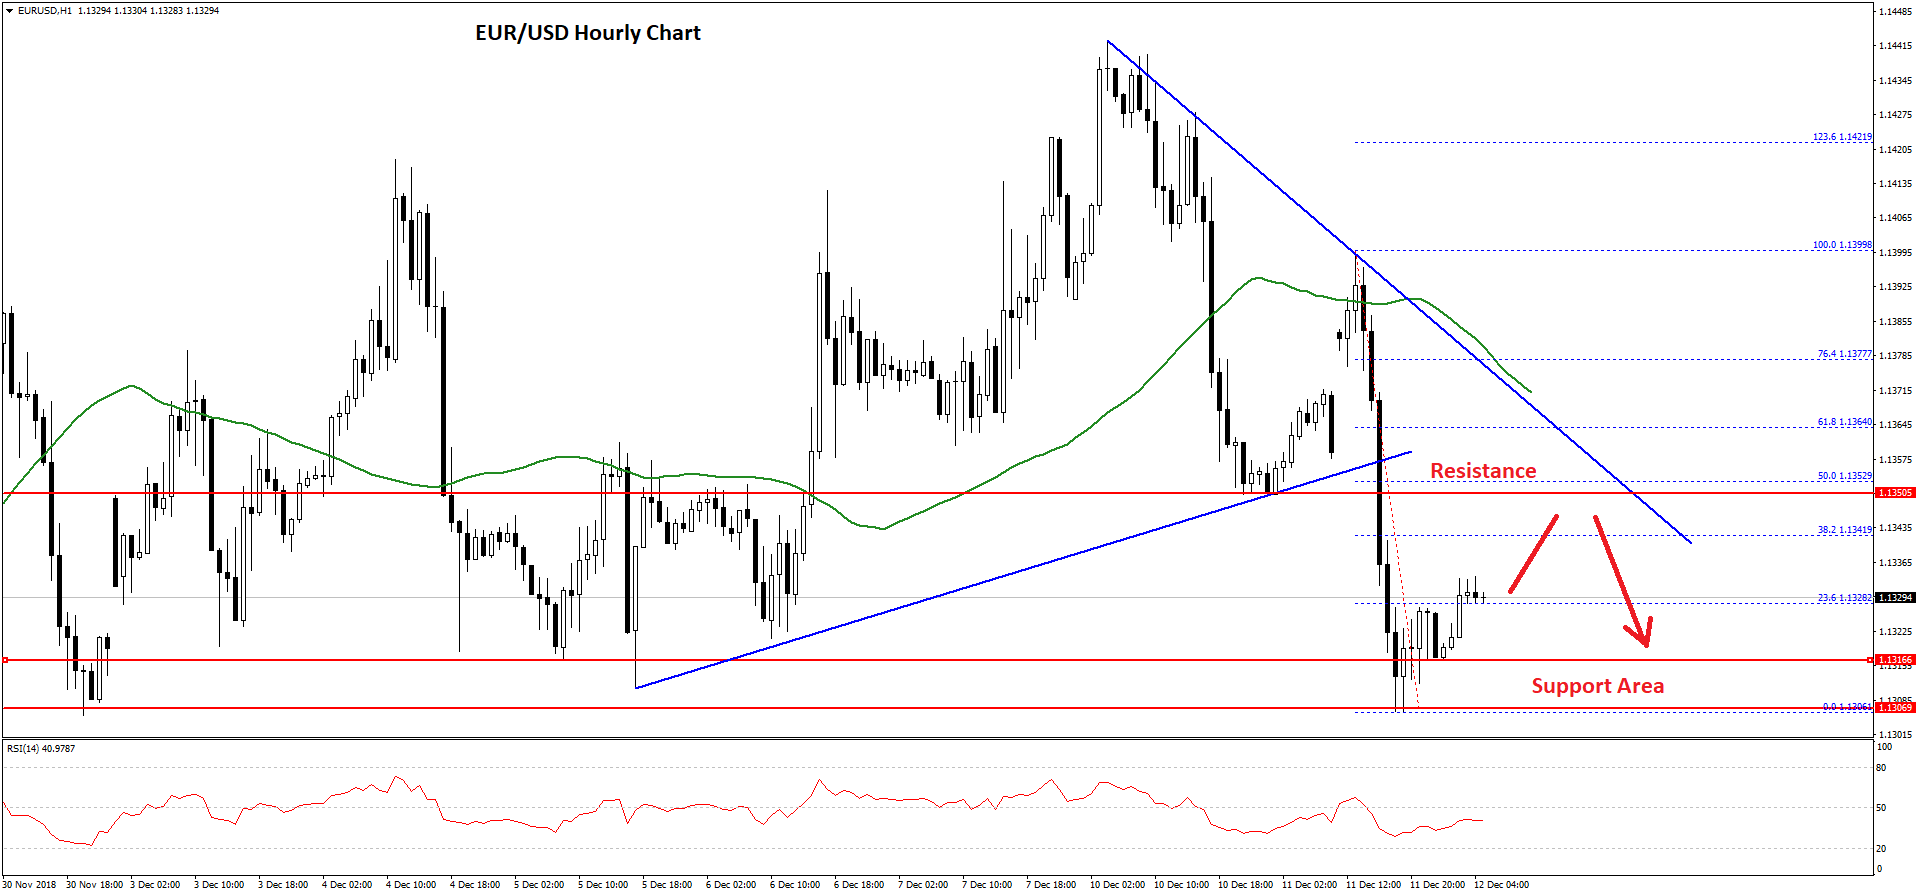
It moved above the 1.1320 level and the 23.6% Fib retracement level of the last decline from the 1.1400 swing high to 1.1306 low. However, there are many resistances aligned on the upside near the 1.1350 and 1.1355 levels.
More importantly, there is a crucial bearish trend line formed with resistance at 1.1358 on the hourly chart. The trend line is close to the 50% Fib retracement level of the last decline from the 1.1400 swing high to 1.1306 low.
In the short term, the pair is likely to continue to trade higher towards the 1.1350 and 1.1355 resistance levels. However, it won’t be easy for buyers to clear the 1.1355-60 zone, above which the pair might surge towards 1.1400.
On the downside, the 1.1320 level is an initial support, followed by the key 1.1300-10 support zone.
USD/CHF Technical Analysis
This past week, there was a slow and steady decline in the US Dollar from the 1.0000 resistance area against the Swiss franc. The USD/CHF pair declined and traded below the 0.9950 and 0.9900 support levels.
There was also a break below the 0.9880 support level and the 50 hourly simple moving average. A new weekly low was formed recently at 0.9862 and later the pair started an upside correction.
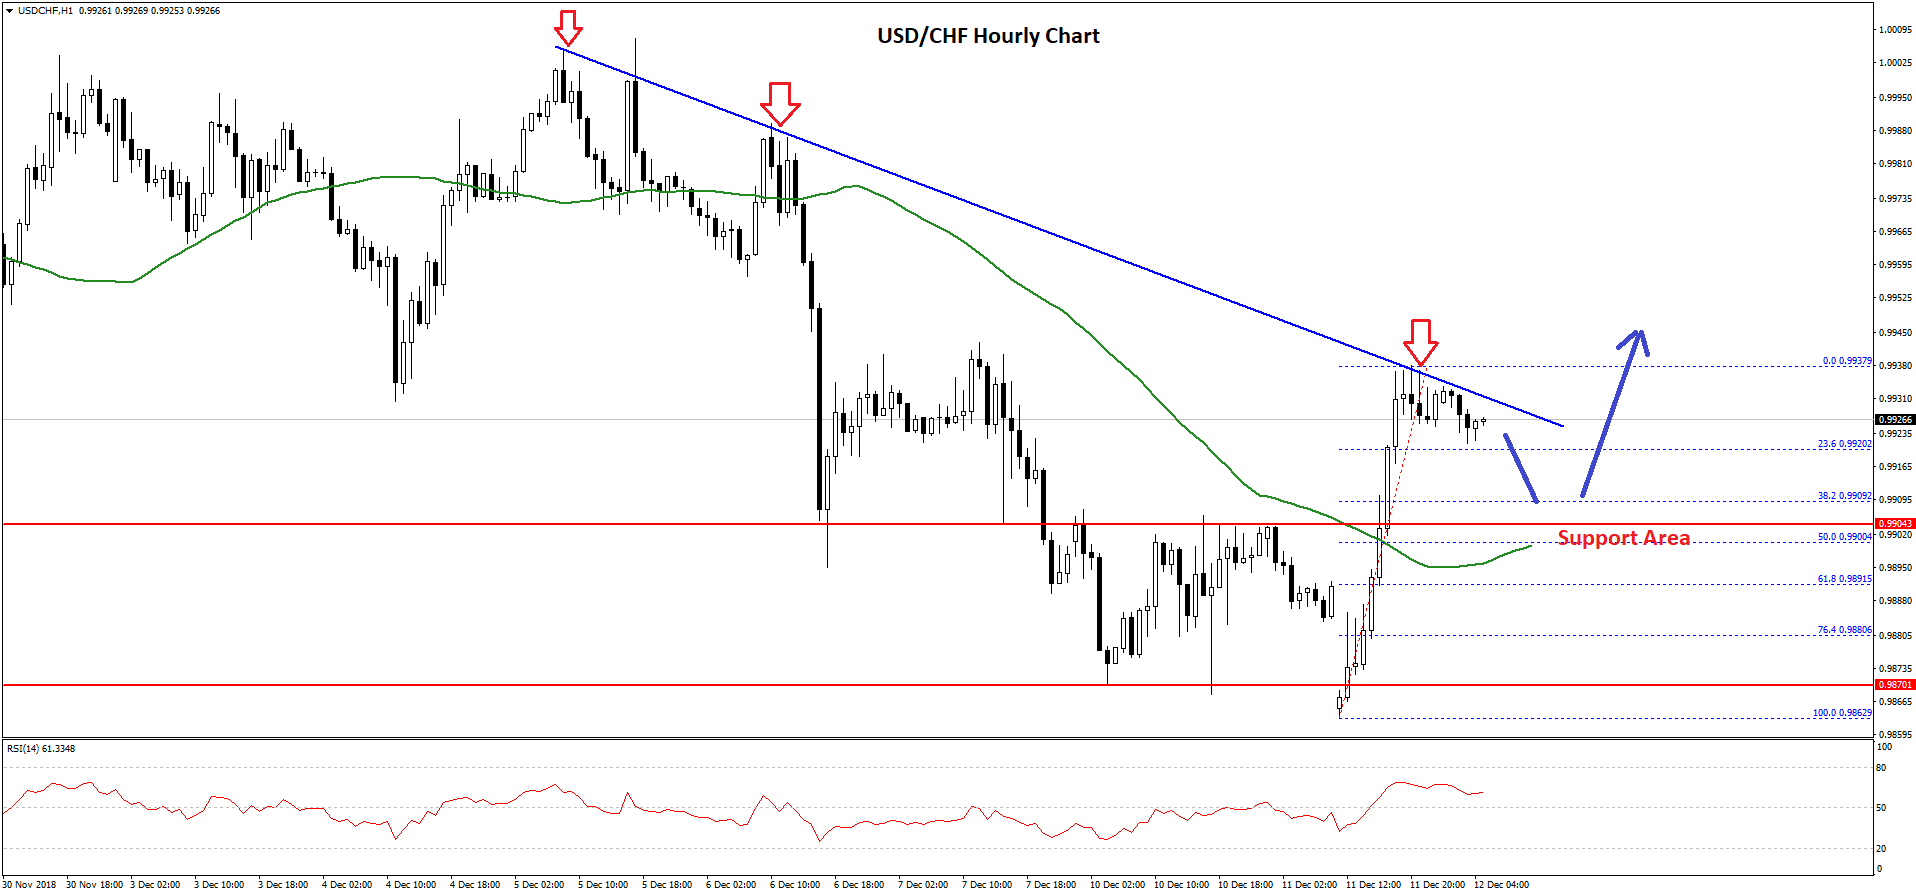
It jumped above the 0.9900 resistance and settled above the 50 hourly simple moving average. The current price action is positive, but the pair is facing a major resistance near 0.9930-35. Moreover, there is a key bearish trend line in place with resistance at 0.9930 on the hourly chart.
Therefore, a proper break above the trend line and a close above 0.9940 could open the doors for more gains towards 0.9980 or even 1.0000. On the downside, an initial support is near the 0.9920 level and the 23.6% Fib retracement level of the recent wave from the 0.9862 low to 0.9937 high.
However, the key support for buyers is near the 0.9900 level and the 5% Fib retracement level of the recent wave from the 0.9862 low to 0.9937 high, with the 50 hourly SMA.
Overall, it seems like dips remain supported in both EUR/USD and USD/CHF in the near term.
Trade over 50 forex markets 24 hours a day with FXOpen. Take advantage of low commissions, deep liquidity, and spreads from 0.0 pips. Open your FXOpen account now or learn more about trading forex with FXOpen.
This article represents the opinion of the Companies operating under the FXOpen brand only. It is not to be construed as an offer, solicitation, or recommendation with respect to products and services provided by the Companies operating under the FXOpen brand, nor is it to be considered financial advice.
Latest from Forex Analysis
Latest articles

The Price of Gold XAU/USD Shows Strongest Fall in Almost 2 Years
On Monday, the price of gold fell from USD 2,386 to USD 2,333 per ounce — this is the strongest drop in one day in almost 2 years, according to Bloomberg. On Tuesday morning in the Asian session, the

Hong Kong-listed Chinese Insurer Goes on Rally as Western Giants Retract
The Asia Pacific region has once again become an area of great interest to investors and traders as some remarkable patterns of volatility have begun to make their presence felt.
This morning, a few examples of Hong Kong-listed Chinese companies

Bitcoin Price Bullish after Halving-2024
On April 19, 2024, a halving occurred in the Bitcoin network, resulting in the reward for the mined block amounting to 3.125 BTC.
Historically, after the halving (which is associated with a reduction in supply), the price of Bitcoin