


FXOpen
EUR/USD declined after trading towards the 1.1470 level and tested an important support. USD/CHF is currently under pressure below the 0.9960 and 0.9970 resistances.
Important Takeaways for EUR/USD and USD/CHF
- The Euro recovered recently before sellers appeared near the 1.1470 level against the US Dollar.
- There was a break below a major bullish trend line with support at 1.1395 on the hourly chart of EUR/USD.
- USD/CHF is trading below the 0.9960 and 0.9970 resistance levels.
- The pair traded below a major declining channel with support at 1.0010 on the hourly chart.
EUR/USD Technical Analysis
The Euro started a solid recovery from the 1.1220 swing low against the US Dollar. The EUR/USD pair traded above the 1.1300 and 1.1380 resistance levels to move into a positive zone.
The pair even broke the 1.1420 resistance and traded towards the 1.1480 resistance. It traded as high as 1.1472 on FXOpen and later started a downside correction. It declined below the 1.1420 support and the 50 hourly simple moving average.
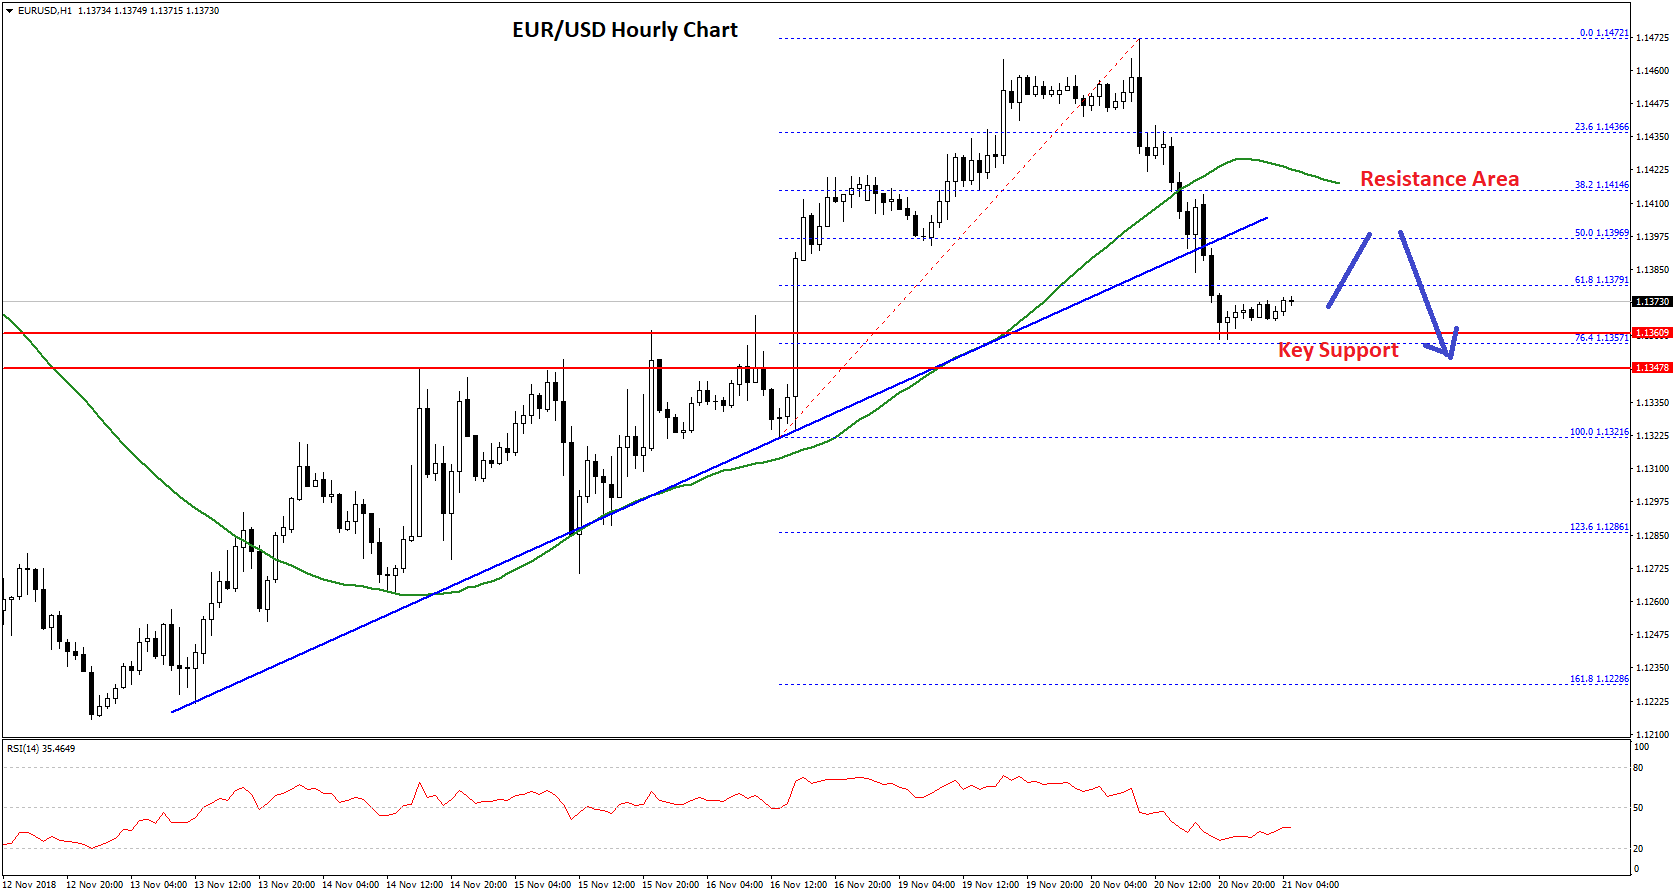
It opened the doors for more declines and the pair broke a major bullish trend line with support at 1.1395 on the hourly chart. Moreover, there was a break below the 50% Fib retracement level of the last wave from the 1.1228 low to 1.1472 high.
The pair declined below the 1.1380 support before buyers appeared near the 1.1360 support area. Besides, the 76.4% Fib retracement level of the last wave from the 1.1228 low to 1.1472 high is also acting as a support.
In the short term, the pair could recover above the 1.1380 and 1.1400 levels. However, upsides are likely to be capped near the 1.1420 level and the 50 hourly SMA.
On the downside, a break below the 1.1360 and 1.1350 support levels could start a fresh decline in EUR/USD. The next support awaits at 1.1280.
USD/CHF Technical Analysis
The US Dollar failed to move above the 1.0120 resistance area against the Swiss franc. The USD/CHF pair started a downside move and traded below the 1.0050 and 1.0020 support levels.
During the decline, the pair broke a major declining channel with support at 1.0010 on the hourly chart. Sellers took control and pushed the pair below the 0.9980 support and the 50 hourly simple moving average.
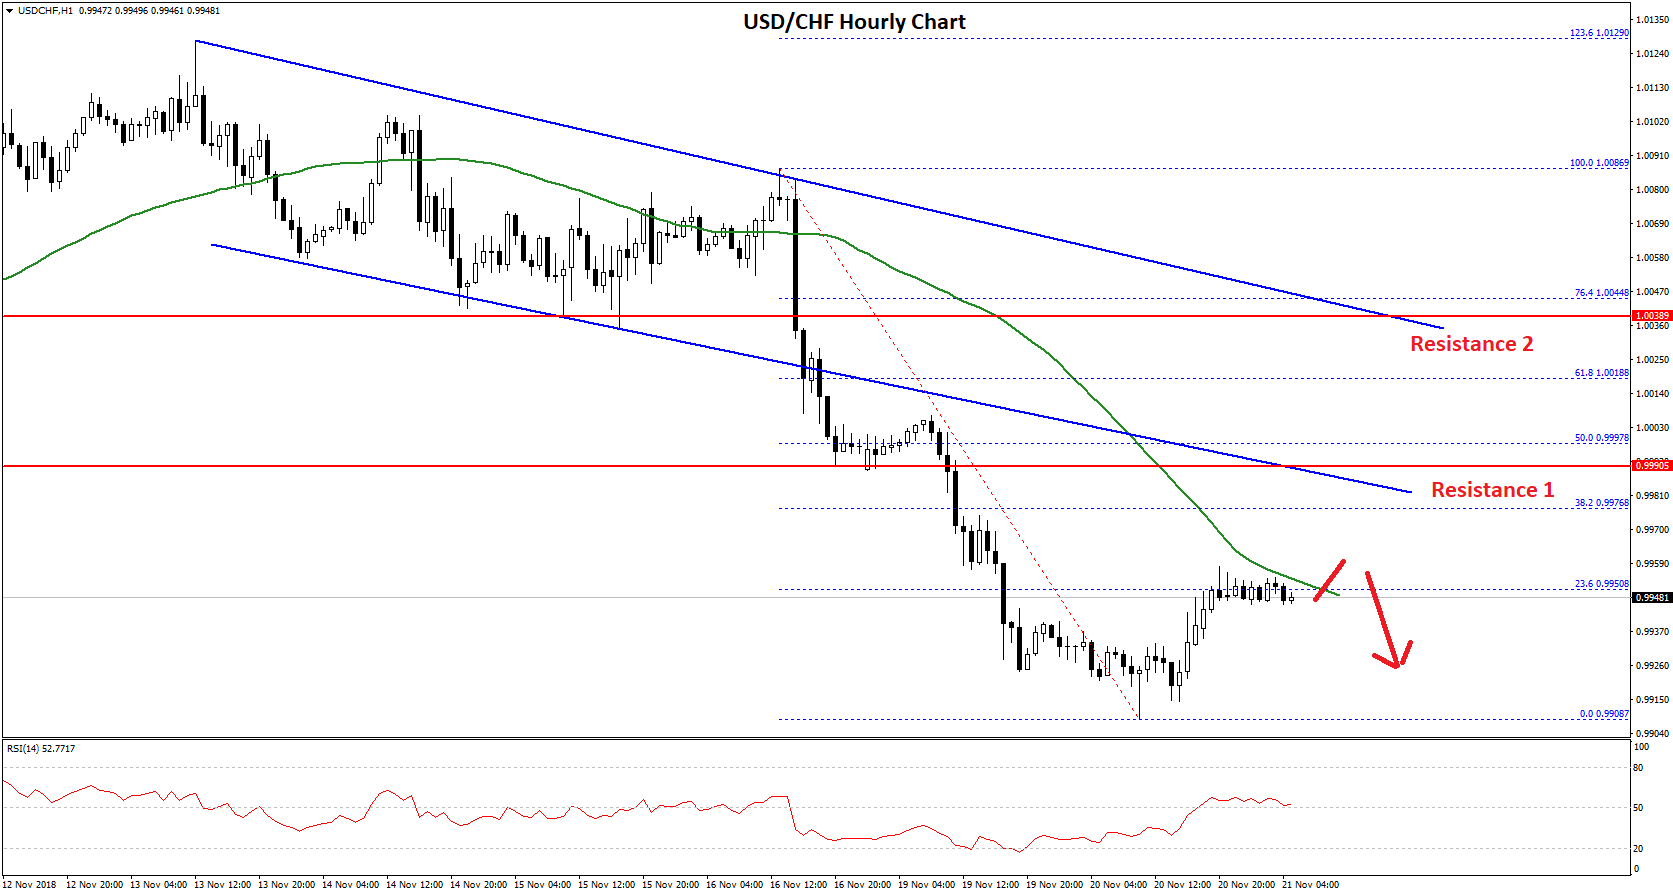
The pair traded towards the 0.9900 level and formed a low at 0.9908. Later, the pair corrected higher and moved above the 0.9930 level. However, the pair is facing resistance near the 0.9950 level, 50 hourly SMA and the 23.6% Fib retracement level of the last decline from the 1.0089 high to 0.9908 low.
If the pair moves above the 0.9950 resistance, the next major resistances are at 0.9960 and 0.9970. Overall, it won’t be easy for buyers to clear 0.9970 since it represents a major pivot zone.
Therefore, there are high chances that the pair could decline once again if buyers fail to clear the 0.9950-0.9970 resistance zone. On the downside, an initial support is at 0.9930, below which the pair may revisit the 0.9900 support.
On the other hand, if buyers manage to push USD/CHF above 0.9970, the pair will most likely climb further above the 1.0000 and 1.0020 resistance levels in the near term.
Trade over 50 forex markets 24 hours a day with FXOpen. Take advantage of low commissions, deep liquidity, and spreads from 0.0 pips. Open your FXOpen account now or learn more about trading forex with FXOpen.
This article represents the opinion of the Companies operating under the FXOpen brand only. It is not to be construed as an offer, solicitation, or recommendation with respect to products and services provided by the Companies operating under the FXOpen brand, nor is it to be considered financial advice.
Latest from Forex Analysis
Latest articles

Weekly Market Wrap With Gary Thomson: UK100, USD, GOLD, OIL
Get the latest scoop on the week's hottest headlines, all in one convenient video. Join Gary Thomson, the COO of FXOpen UK, as he breaks down the most significant news reports and shares his expert insights.
- UK100 Share Index Rises

What Is a Darvas Box Theory and How Does It Work in Trading?
The Darvas Box Theory, pioneered by Nicolas Darvas in the 1950s, has transcended its stock market origins to become a valuable tool for forex traders. This method leverages specific price movements and patterns, known as the Darvas Box, to track

NFLX Stock Price Falls Despite Subscriber Growth
Yesterday, after the close of the main trading session on the stock market, Netflix reported to investors for the 1st quarter of 2024.
The report turned out better than expected:
→ earnings per share: actual = USD 5.28, forecast = USD 4.