


FXOpen

EUR/USD is currently facing a strong resistance near the 1.0880 and 1.0900 levels. EUR/JPY is slowly rising and it is struggling to stay above a major support at 116.15.
Important Takeaways for EUR/USD and EUR/JPY
- The Euro is struggling to gain traction above the 1.0880 and 1.0900 resistance levels.
- There was a break above a key bearish trend line with resistance near 1.0845 on the hourly chart of EUR/USD.
- EUR/JPY remained in a strong uptrend above the 115.50 and 116.00 support levels.
- There is a major bullish trend line forming with support near 116.20 on the hourly chart.
EUR/USD Technical Analysis
In the past few sessions, the Euro remained stable above the 1.0785 and 1.0800 support levels against the US Dollar. The EUR/USD pair started a decent recovery and climbed above the 1.0820 resistance.
Besides, there was break above the 1.0850 resistance zone and the 50 hourly simple moving average. During the rise, there was a break above a key bearish trend line with resistance near 1.0845 on the hourly chart of EUR/USD.
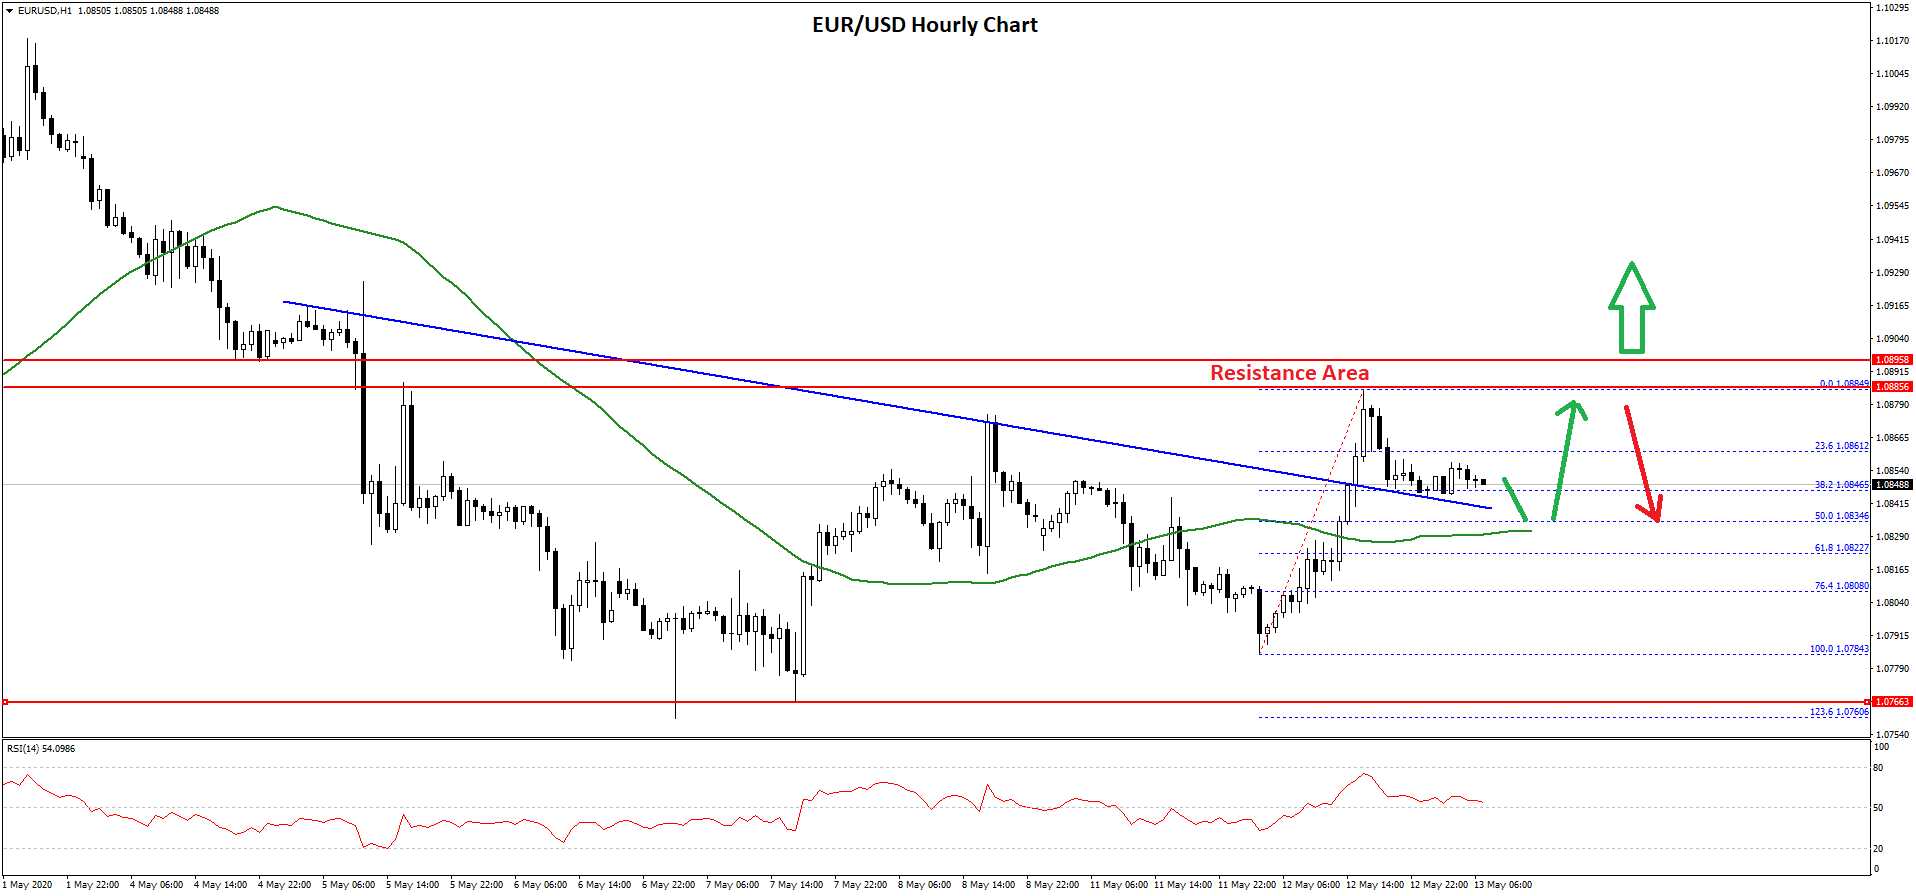
The pair even spiked above the 1.0880 level and traded as high as 1.0884 on FXOpen. It failed to continue higher above the 1.0880 and 1.0900 resistance levels.
It is currently correcting lower and trading below the 1.0860 level. There was a break below the 23.6% Fib retracement level of the recent wave from the 1.0784 low to 1.0884 high.
It is now retesting the broken trend line at 1.0845. An initial support is near the 1.0834 level since it is the 50% Fib retracement level of the recent wave from the 1.0784 low to 1.0884 high.
The next major support is near the 1.0830 level and the 50 hourly simple moving average, below which the price could extend its decline towards the 1.0800 level.
On the upside, the bulls need to gain pace above the 1.0880 and 1.0900 resistance levels. A successful close above the 1.0900 resistance could lift the pair towards the 1.0950 and 1.0970 levels.
EUR/JPY Technical Analysis
The Euro started a strong upward move from the 114.50 zone against the Japanese Yen. The EUR/JPY pair broke many hurdles near 115.00 and 115.20 to move into a positive zone.
Besides, there was a clear break above the 115.95 resistance and the 50 hourly simple moving average. The pair even climbed above the 116.50 level and traded as high as 116.84.
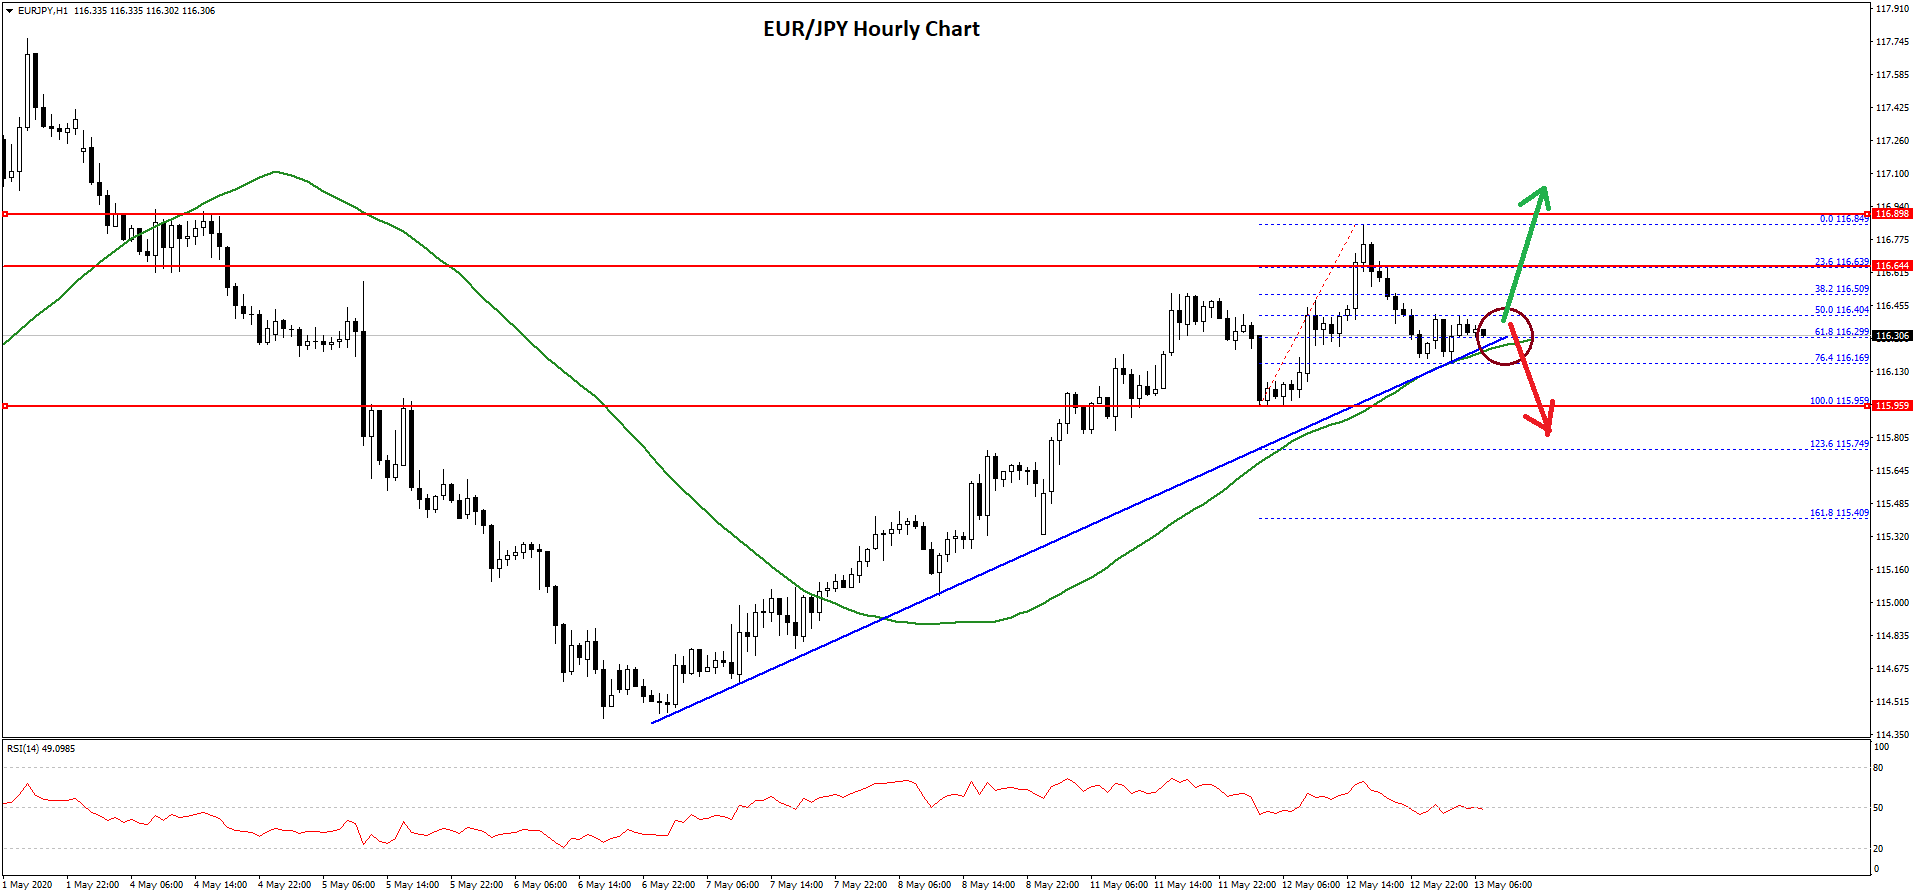
Recently, there was a downside correction below the 116.50 level. The pair traded below the 50% Fib retracement level of the recent upward move from the 115.95 low to 116.84 high.
At the moment, the pair is testing the 116.25 support and the 50 hourly simple moving average. There is also a major bullish trend line forming with support near 116.20 on the hourly chart.
The trend line is close to the 76.4% Fib retracement level of the recent upward move from the 115.95 low to 116.84 high. Therefore, a downside break below the 116.25 and 116.20 support levels might open the doors for a larger decline in the near term.
Conversely, EUR/JPY might stay above 116.20 and continue to rise. A clear break above 116.80 and 117.00 could open the doors for a strong push towards the 118.00 level.
Trade over 50 forex markets 24 hours a day with FXOpen. Take advantage of low commissions, deep liquidity, and spreads from 0.0 pips. Open your FXOpen account now or learn more about trading forex with FXOpen.
This article represents the opinion of the Companies operating under the FXOpen brand only. It is not to be construed as an offer, solicitation, or recommendation with respect to products and services provided by the Companies operating under the FXOpen brand, nor is it to be considered financial advice.
Latest from Forex Analysis
Latest articles

Market Analysis: AUD/USD and NZD/USD Turn Red
AUD/USD declined below the 0.6500 and 0.6455 support levels. NZD/USD is also moving lower and might struggle to recover above 0.5950.
Important Takeaways for AUD/USD and NZD/USD Analysis Today
· The Aussie Dollar started

Since the Start of the Week, Brent Oil Price Has Dropped over 4%
At the beginning of the week, March 15, we wrote that the price of Brent oil could form a correction from the resistance level of USD 91 per barrel. Since then, the price has decreased by more than 4% due

Fair Value Gaps vs Liquidity Voids in Trading
Understanding fair value gaps and liquidity voids is essential for traders seeking to navigate the complexities of the financial markets. These concepts, deeply rooted in the Smart Money Concept (SMC), provide valuable insights into the dynamics of supply and demand,