


EUR/USD and EUR/JPY: Euro Remains At Risk
FXOpen

EUR/USD started another decline below 1.1820. EUR/JPY is also declining and it broke the 129.80 support zone.
Important Takeaways for EUR/USD and EUR/JPY
· The Euro failed to clear the 1.1880 resistance and started a fresh decline.
· There is a key bearish trend line forming with resistance near 1.1820 on the hourly chart.
· EUR/JPY also started a fresh decline from well above the 130.00 level.
· There was a break below a declining channel with support near 129.50 on the hourly chart.
EUR/USD Technical Analysis
The Euro started a major decline after it struggled to clear the 1.1880 resistance against the US Dollar. The EUR/USD pair broke the 1.1820 support zone to move into a bearish zone.
The pair even traded below the 1.1800 support and settled below the 50 hourly simple moving average. A low was formed near 1.1769 on FXOpen and the pair is now correcting losses. There was a break above the 1.1800 level.
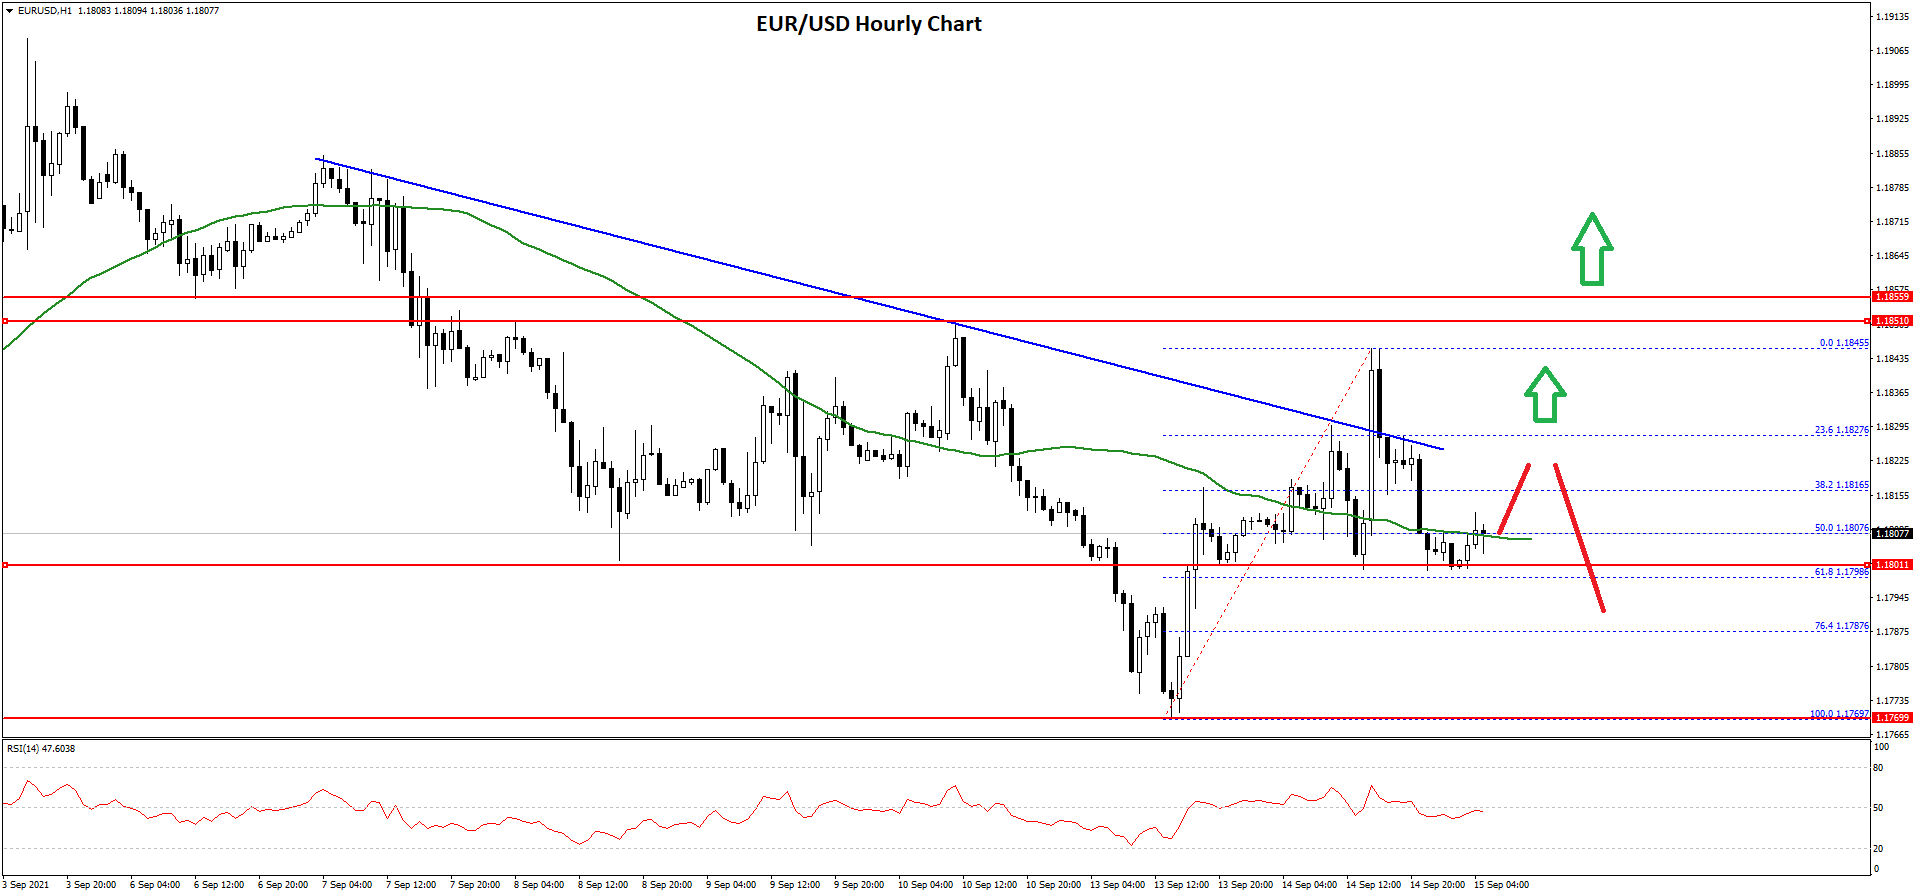
The pair even spiked above the 1.1820 resistance level and a key bearish trend line with current resistance near 1.1820 on the hourly chart.
However, the bulls failed to remain in action above 1.1835. A high was formed near 1.1845 and the pair declined once again. It traded below the 50% Fib retracement level of the upward move from the 1.1769 swing low to 1.1845 high.
It is now consolidating near the 1.1800 level and the 50 hourly simple moving average. An immediate resistance is near the 1.1820 level. The main resistance is still forming near the 1.1840 and 1.1850 levels. A clear break above the 1.1850 resistance could push EUR/USD towards 1.1900.
On the downside, the 1.1800 level is a major support. Any more losses might lead EUR/USD towards the 1.1750 support zone in the near term. The next major support sits near the 1.1720 level.
EUR/JPY Technical Analysis
The Euro started a fresh decline from well above 130.50 against the Japanese Yen. The EUR/JPY pair traded below the 130.00 support zone to move into a bearish zone.
There was a break below the 129.50 support zone and the 50 hourly simple moving average. There was also a break below a declining channel with support near 129.50 on the hourly chart. The pair tested the 129.35 zone and a low is formed near 129.32.
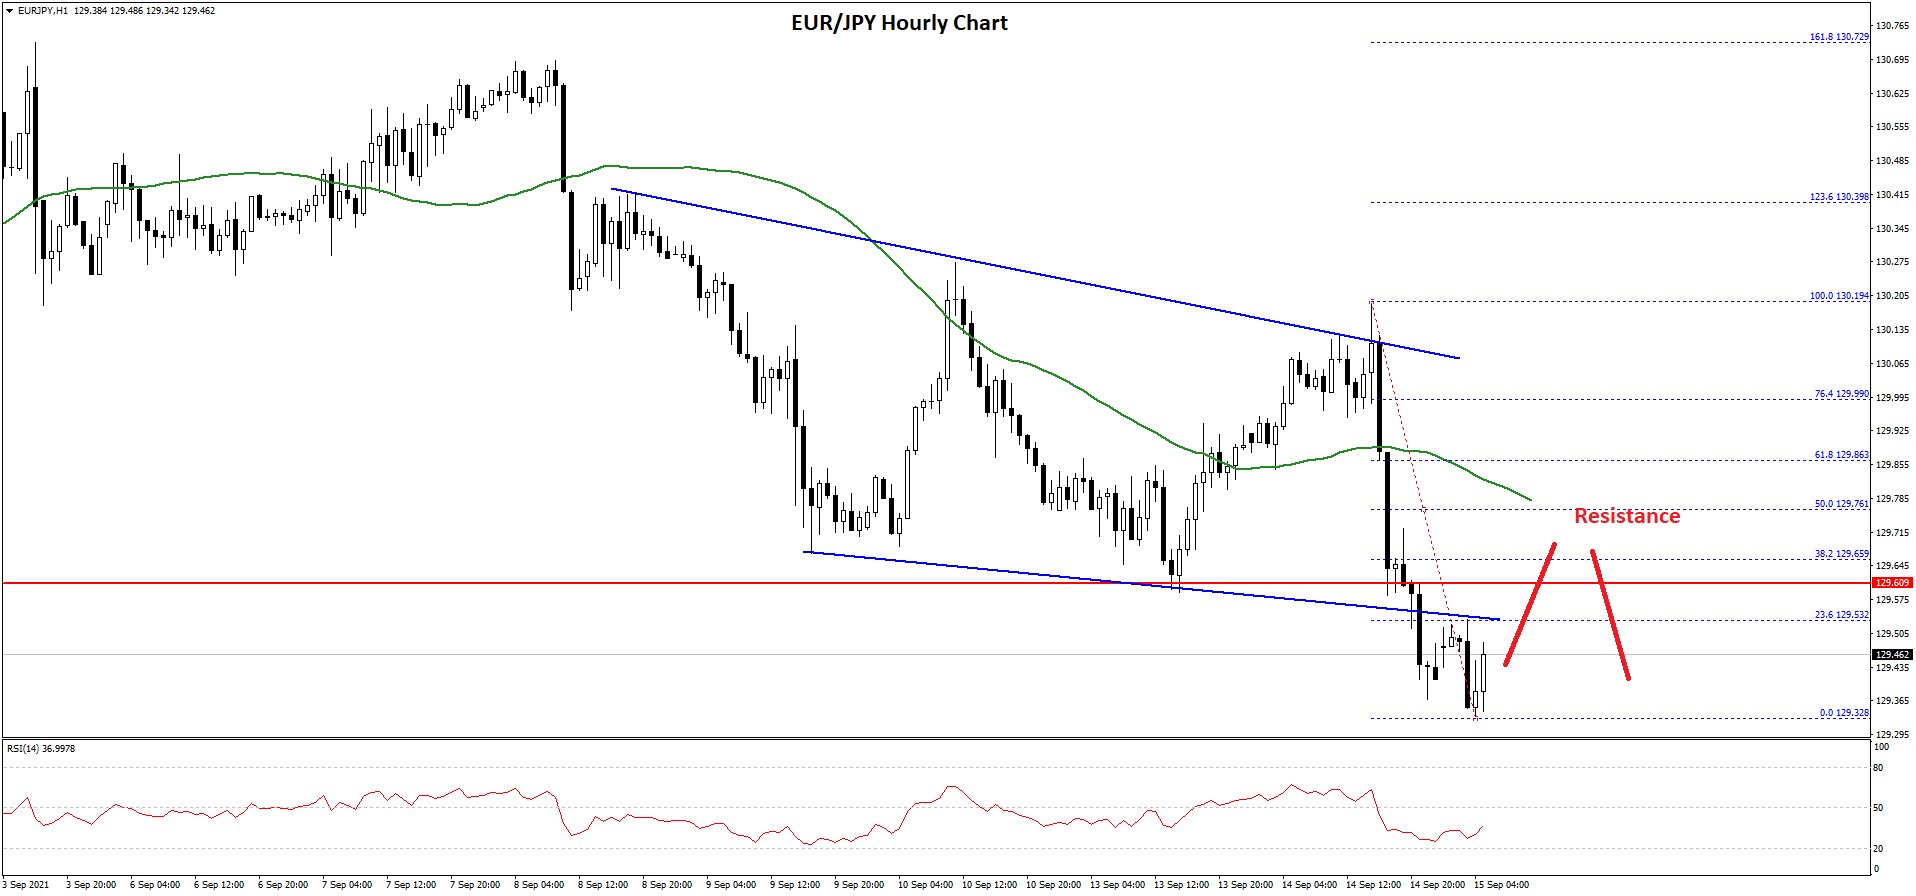
It is now attempting a recovery wave above the 129.50 resistance. The 23.6% Fib retracement level of the recent drop from the 130.19 high to 129.32 low is also near the 129.50 level.
The main resistance is now forming near the 129.75 level and the 50 hourly simple moving average. It is close to the 50% Fib retracement level of the recent drop from the 130.19 high to 129.32 low. If there is an upside break above the 129.75 resistance, the pair could start a decent recovery above 130.00.
The next major resistance could be near the 130.50 level. Any more gains could lead the pair towards the 131.20 level. On the downside, an initial support is near the 129.35 level.
The first major support is near the 129.20 level. The next major support is near the 129.00 level. Any more losses could lead the pair towards the 128.40 support level in the near term.
This forecast represents FXOpen Markets Limited opinion only, it should not be construed as an offer, invitation or recommendation in respect to FXOpen Markets Limited products and services or as financial advice.
This article represents the opinion of the Companies operating under the FXOpen brand only. It is not to be construed as an offer, solicitation, or recommendation with respect to products and services provided by the Companies operating under the FXOpen brand, nor is it to be considered financial advice.
Stay ahead of the market!
Subscribe now to our mailing list and receive the latest market news and insights delivered directly to your inbox.

Latest articles

AUD/CAD: Pair Remains Range-Bound Amid Interest Rate Divergence
The key macroeconomic factor for AUD/CAD remains the divergence in monetary policy between the two central banks. After three consecutive rate hikes since the beginning of the year, the Reserve Bank of Australia left its cash rate unchanged at

Brent Crude Oil Analysis: Stabilisation or Simply a Pause?
Over the past few weeks, financial markets have been more focused than ever on developments surrounding the Strait of Hormuz — a critical waterway at the centre of ongoing US-Iran negotiations. The back-and-forth of diplomatic headlines has injected significant volatility into

Gold Analysis: Could XAU/USD Bounce From the Crucial $4,000 Level?
The year 2026 has so far been an unforgiving one for gold. XAU/USD is down approximately 7% since the start of the year, and roughly 28% from the late-January peak — a significant correction, though a physiologically natural one following