


FXOpen
EUR/USD is struggling to recover above the 1.1600 resistance. EUR/JPY is diving, and it could extend losses below the 130.50 support.
Important Takeaways for EUR/USD and EUR/JPY
· The Euro started a recovery wave above the 1.1550 and 1.1560 levels.
· There is a key contracting triangle forming with support near 1.1580 on the hourly chart.
· EUR/JPY is declining and is trading below the 131.20 level.
· There is a key bearish trend line forming with resistance near 131.00 on the hourly chart.
EUR/USD Technical Analysis
The Euro started another decline after it struggled to clear the 1.1620 resistance against the US Dollar. The EUR/USD pair broke the 1.1550 support zone to move into a bearish zone.
The pair even traded below the 1.1520 support and settled below the 50 hourly simple moving average. A low was formed near 1.1513 on FXOpen and the pair is now correcting losses. There was a break above the 1.1550 and 1.1560 resistance levels.
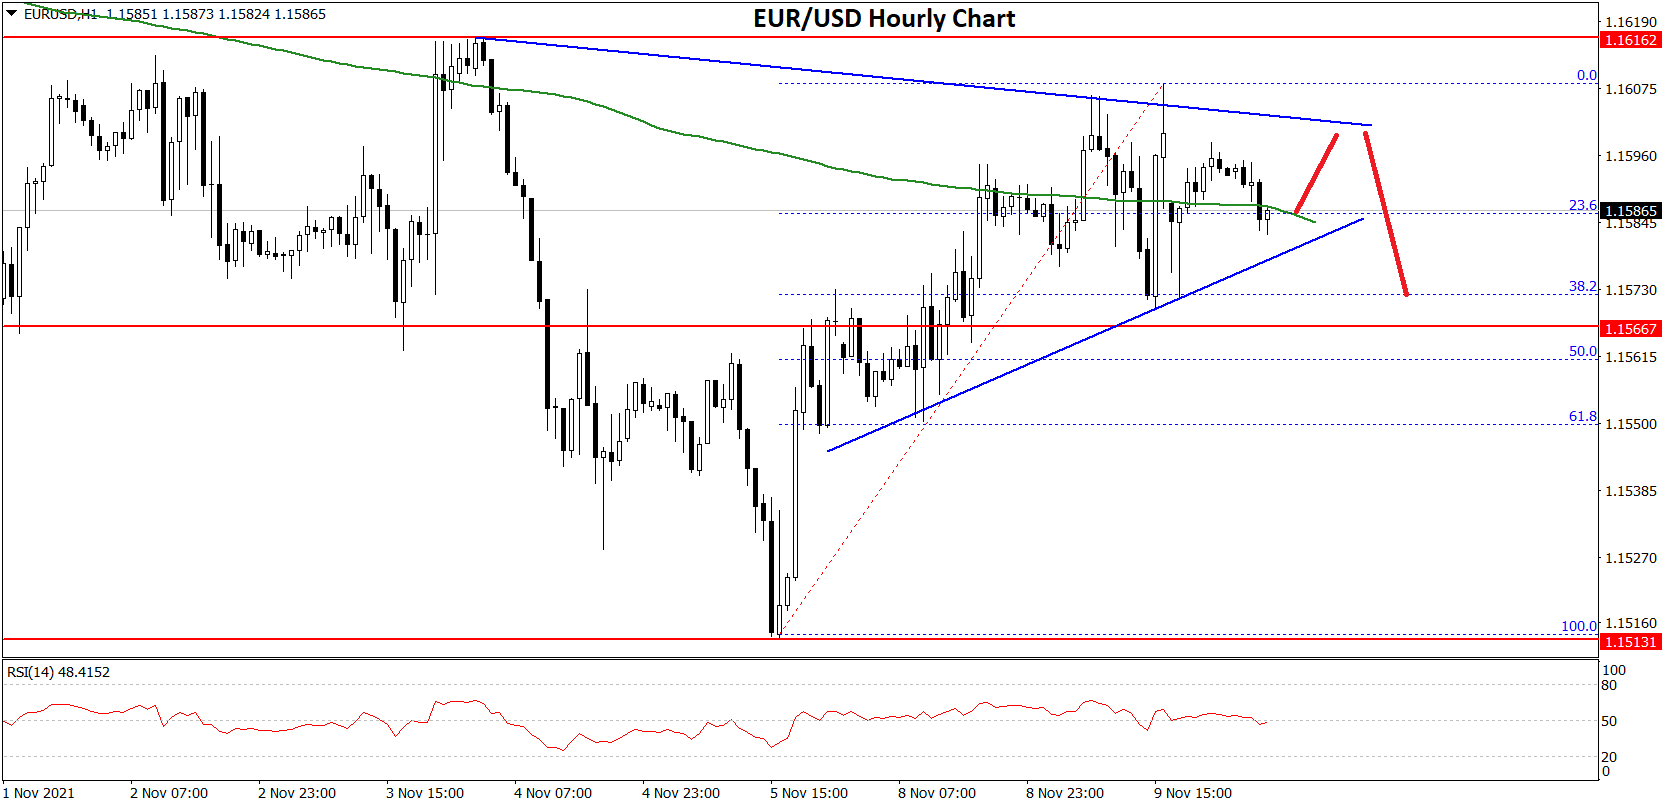
The pair even spiked above 1.1600 and the 50 hourly simple moving average. However, it is facing hurdles near the 1.1620 level. The pair is now correcting lower and trading near the 23.6% Fib retracement level of the upward move from the 1.1513 swing low to 1.1607 high.
On the downside, the 1.1580 level is a major support. There is also a key contracting triangle forming with support near 1.1580 on the hourly chart.
Any more losses might lead EUR/USD towards the 1.1525 support zone in the near term. The next major support sits near the 1.1500 level. On the upside, the first major resistance is near the 1.1600 level.
The main resistance is near the 1.1620 level. A clear break above the 1.1620 resistance could push EUR/USD towards 1.1665.
EUR/JPY Technical Analysis
The Euro started a fresh decline from well above 133.00 against the Japanese Yen. The EUR/JPY pair traded below the 132.00 support zone to move into a bearish zone.
There was a break below the 131.50 support zone and the 50 hourly simple moving average. The pair even broke the 131.00 level and a low is formed near 130.68. It is now consolidating losses near the 130.70 level.
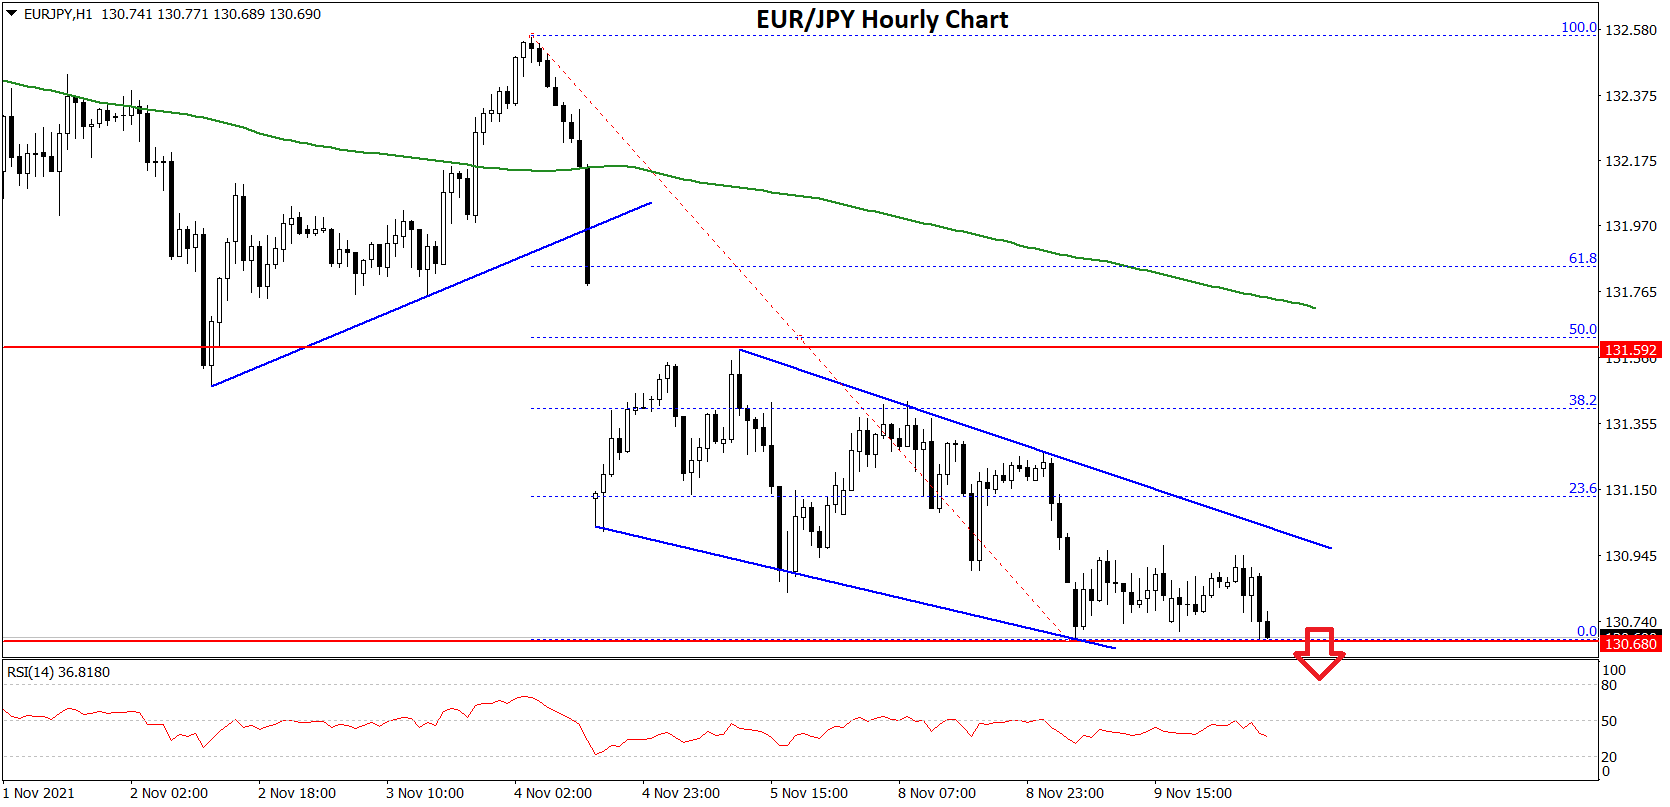
An immediate resistance is near the 130.90 level. There is also a key bearish trend line forming with resistance near 131.00 on the hourly chart. The first major resistance is near the 131.15 level.
The 23.6% Fib retracement level of the recent decline from the 132.56 high to 130.68 low is also near the 131.15 level. The next key resistance is near the 131.60 level, where the bears might take a stand.
Besides, the 50% Fib retracement level of the recent decline from the 132.56 high to 130.68 low sits near 131.60. On the downside, an initial support is near the 130.65 level. The first major support is near the 130.50 level. A downside break below the 130.50 level could spark another major decline.
The next major support is near the 130.00 level. Any more losses could lead the pair towards the 129.20 support level in the near term. In the stated case, the price could test the 128.50 level.
This forecast represents FXOpen Markets Limited opinion only, it should not be construed as an offer, invitation or recommendation in respect to FXOpen Markets Limited products and services or as financial advice.
This article represents the opinion of the Companies operating under the FXOpen brand only. It is not to be construed as an offer, solicitation, or recommendation with respect to products and services provided by the Companies operating under the FXOpen brand, nor is it to be considered financial advice.
Latest from
Latest articles
AUD/USD Rises Sharply on Inflation News
The Consumer Price Index for Australia was released this morning. According to ForexFactory:
→ CPI in quarterly terms: actual = 1.0%, expected = 0.8%, previous value = 0.6%;
→ CPI in annual terms: actual = 3.5%, expected = 3.4%, previous value = 3.

TSLA Share Price Up About 13% Despite Disappointing Report
Yesterday, TSLA trading closed at USD 144.68 per share, after which Tesla reported its results for the 1st quarter:
→ earnings per share: actual = USD 0.45, forecast = USD 0.49;
→ gross income: actual = USD 21.45 billion, forecast = USD

Market Analysis: Gold Price Corrects Gains While Oil Price Regains Strength
Gold price rallied above $2,400 before correcting lower. Crude oil price is rising and it could climb further higher toward the $85.50 resistance.
Important Takeaways for Gold and Oil Prices Analysis Today
· Gold price rallied significantly above $2,