


FXOpen
The Euro and British Pound declined heavily against the Japanese Yen. Both EUR/JPY and GBP/JPY are under pressure and they could continue to weaken in the near term.
Important Takeaways for EUR/JPY and GBP/JPY
- The Euro topped near the 125.50 level and declined heavily against the Japanese Yen.
- There was a break below a major bullish trend line with support at 125.00 on the hourly chart of EUR/JPY.
- GBP/JPY also declined heavily and broke the key 142.00 support area.
- The pair traded below a crucial bullish trend line with support near 142.25 on the hourly chart.
EUR/JPY Technical Analysis
After a solid upward move, the Euro faced a strong resistance near the 125.50 zone against the Japanese Yen. The EUR/JPY pair started a significant decline and broke many supports such as 125.00 and 124.80.
The last swing high was formed at 125.53 on FXOpen before the pair started a bearish wave. During the decline, the pair traded below the 125.00 support and the 50 hourly simple moving average to move into a bearish zone.
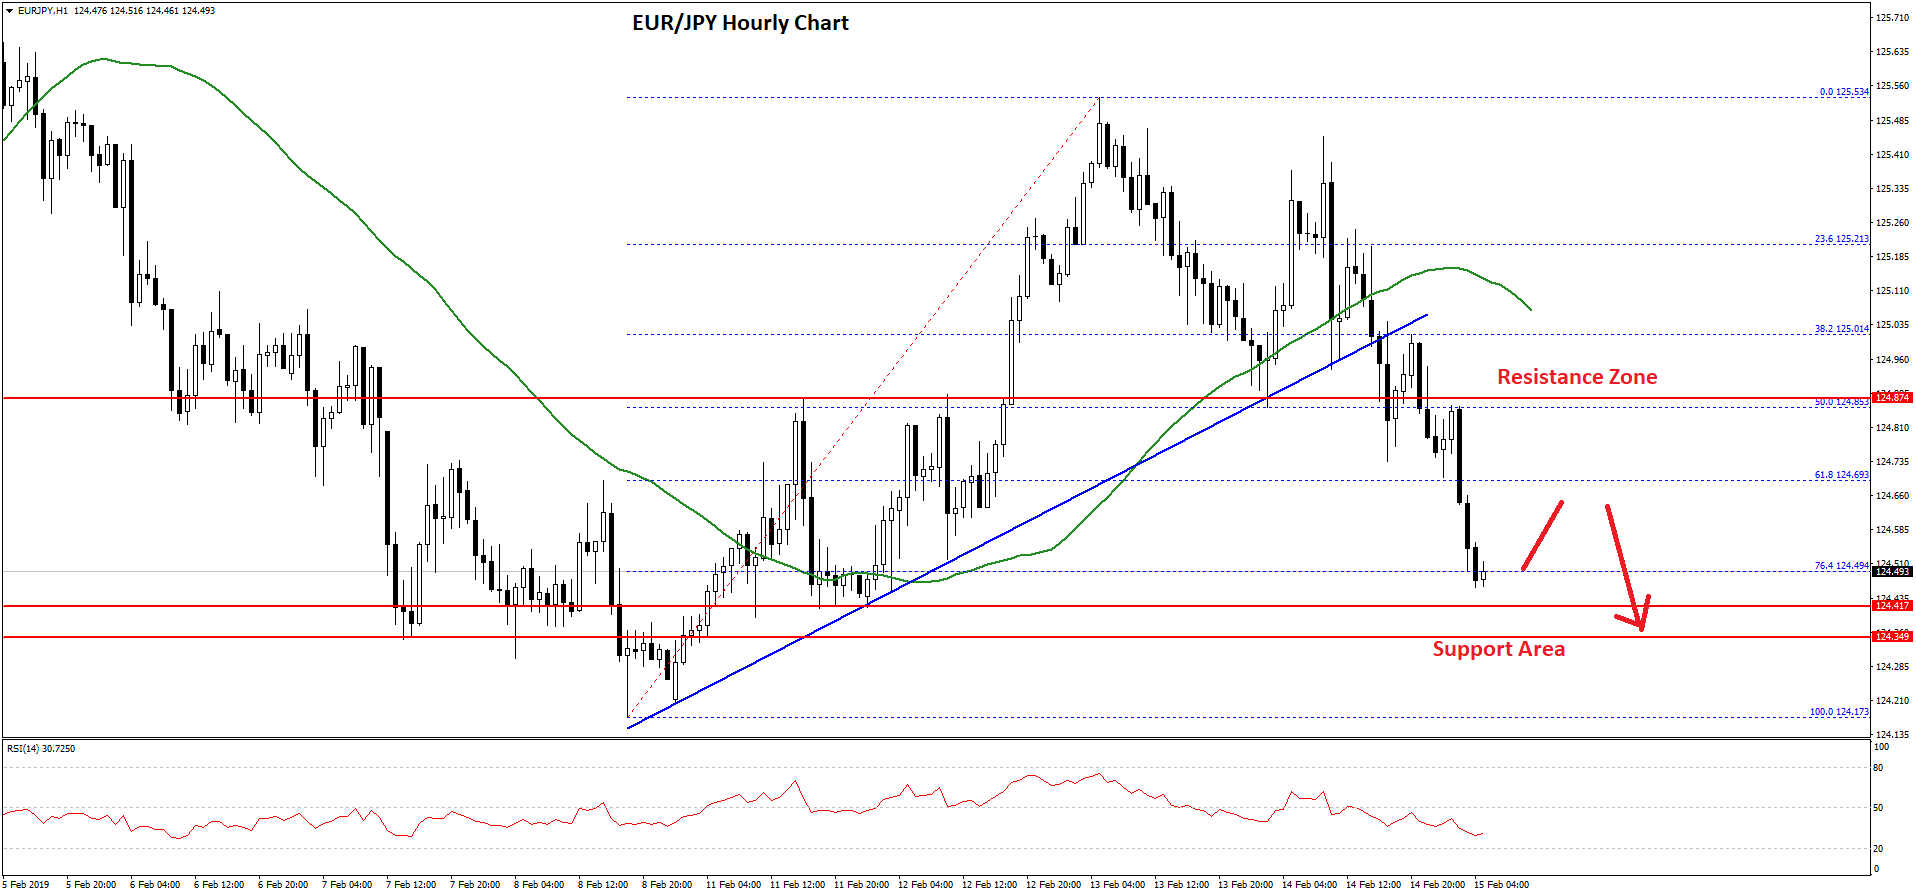
More importantly, there was a break below a major bullish trend line with support at 125.00 on the hourly chart. The pair broke the 61.8% Fib retracement level of the last wave from the 124.17 low to 125.53 high.
The pair is now trading well below the 124.70 support, with bearish signs. An immediate support is near the 124.40 zone, where buyers could take a stand. If there is a break below the 124.40 and 124.35 supports, the pair is likely to extend losses towards the 124.15 swing low.
It is currently trading near the 76.4% Fib retracement level of the last wave from the 124.17 low to 125.53 high, with an immediate resistance near the 124.60 level. However, the main resistance is at 124.80-124.90, which was a support earlier.
Overall, the EUR/JPY pair is currently at a risk of more losses below 124.40 unless buyers push the pair above the 124.90 resistance.
GBP/JPY Technical Analysis
The British Pound also followed a similar structure and declined heavily after forming a high near the 143.33 level against the Japanese Yen. The GBP/JPY pair traded lower and broke many supports such as 142.40 and 142.00.
Besides, there was a break below a crucial bullish trend line with support near 142.25 on the hourly chart. The pair settled below the 142.00 support and the 50 hourly simple moving average.
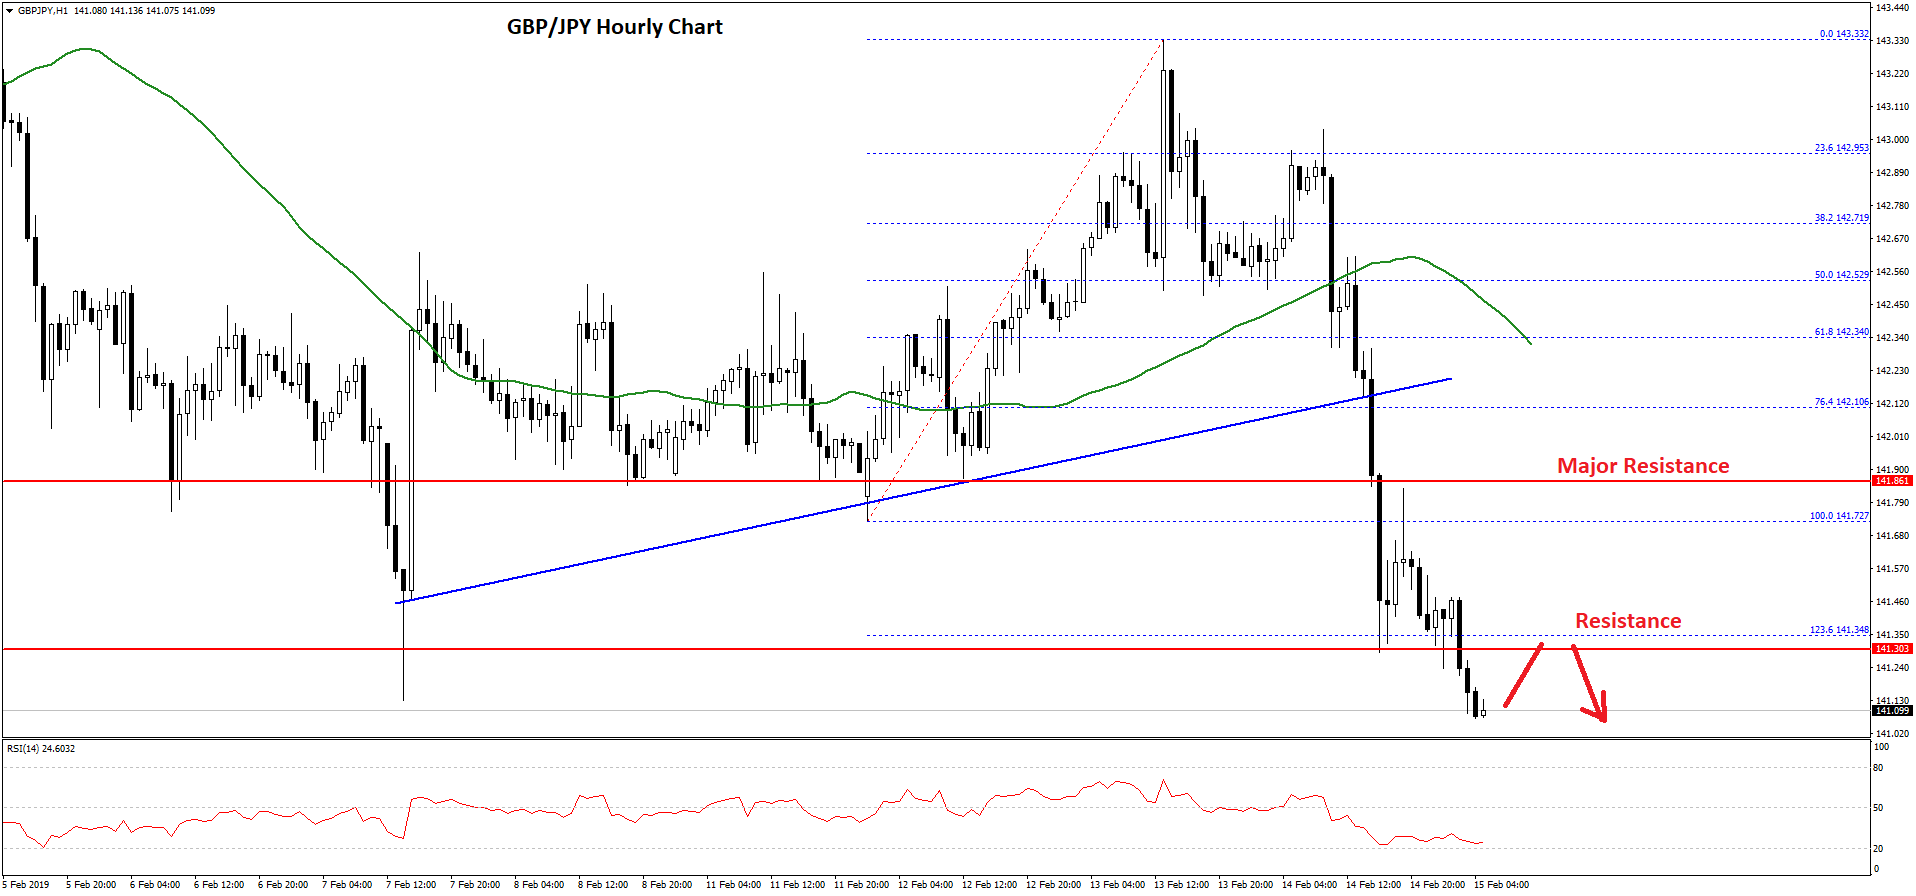
During the decline, the pair broke the 141.80 pivot and the 1.236 Fib extension level of the last wave from the 141.72 low to 143.33 high to move into a bearish zone. The pair is currently trading near the 141.20 level, with a bearish angle.
The next support is near the 141.00 level, below which the pair could trade towards the 140.75 level and the 1.618 Fib extension level of the last wave from the 141.72 low to 143.33 high.
On the other hand, if there is an upside correction, the previous support near the 141.30 level might act as a short term resistance. However, the main resistance is near the 141.80 level, which was a key support earlier for GBP/JPY.
Trade over 50 forex markets 24 hours a day with FXOpen. Take advantage of low commissions, deep liquidity, and spreads from 0.0 pips. Open your FXOpen account now or learn more about trading forex with FXOpen.
This article represents the opinion of the Companies operating under the FXOpen brand only. It is not to be construed as an offer, solicitation, or recommendation with respect to products and services provided by the Companies operating under the FXOpen brand, nor is it to be considered financial advice.
Latest from Forex Analysis
Latest articles

Weekly Market Wrap With Gary Thomson: UK100, USD, GOLD, OIL
Get the latest scoop on the week's hottest headlines, all in one convenient video. Join Gary Thomson, the COO of FXOpen UK, as he breaks down the most significant news reports and shares his expert insights.
- UK100 Share Index Rises

What Is a Darvas Box Theory and How Does It Work in Trading?
The Darvas Box Theory, pioneered by Nicolas Darvas in the 1950s, has transcended its stock market origins to become a valuable tool for forex traders. This method leverages specific price movements and patterns, known as the Darvas Box, to track

NFLX Stock Price Falls Despite Subscriber Growth
Yesterday, after the close of the main trading session on the stock market, Netflix reported to investors for the 1st quarter of 2024.
The report turned out better than expected:
→ earnings per share: actual = USD 5.28, forecast = USD 4.