


FXOpen

The Euro and British Pound are currently correcting higher against the Japanese Yen. However, both EUR/JPY and GBP/JPY are likely to face many hurdles on the upside.
Important Takeaways for EUR/JPY and GBP/JPY
- The Euro declined to a new monthly low at 114.43 and currently correcting higher against the Japanese Yen.
- There is a rising channel forming with resistance near 115.55 on the hourly chart of EUR/JPY.
- GBP/JPY also traded to a new monthly low at 130.65 and it is currently rising.
- There was a break above a key bearish trend line with resistance near 131.60 on the hourly chart.
EUR/JPY Technical Analysis
In the past few days, the Euro declined heavily from well above the 116.50 level against the Japanese Yen. The EUR/JPY pair broke many important supports near 116.00 and 115.80 to enter a bearish zone.
Besides, there was a close below the 115.50 level and the 50 hourly simple moving average. It traded to a new monthly low at 114.43on FXOpen and it is currently correcting higher.
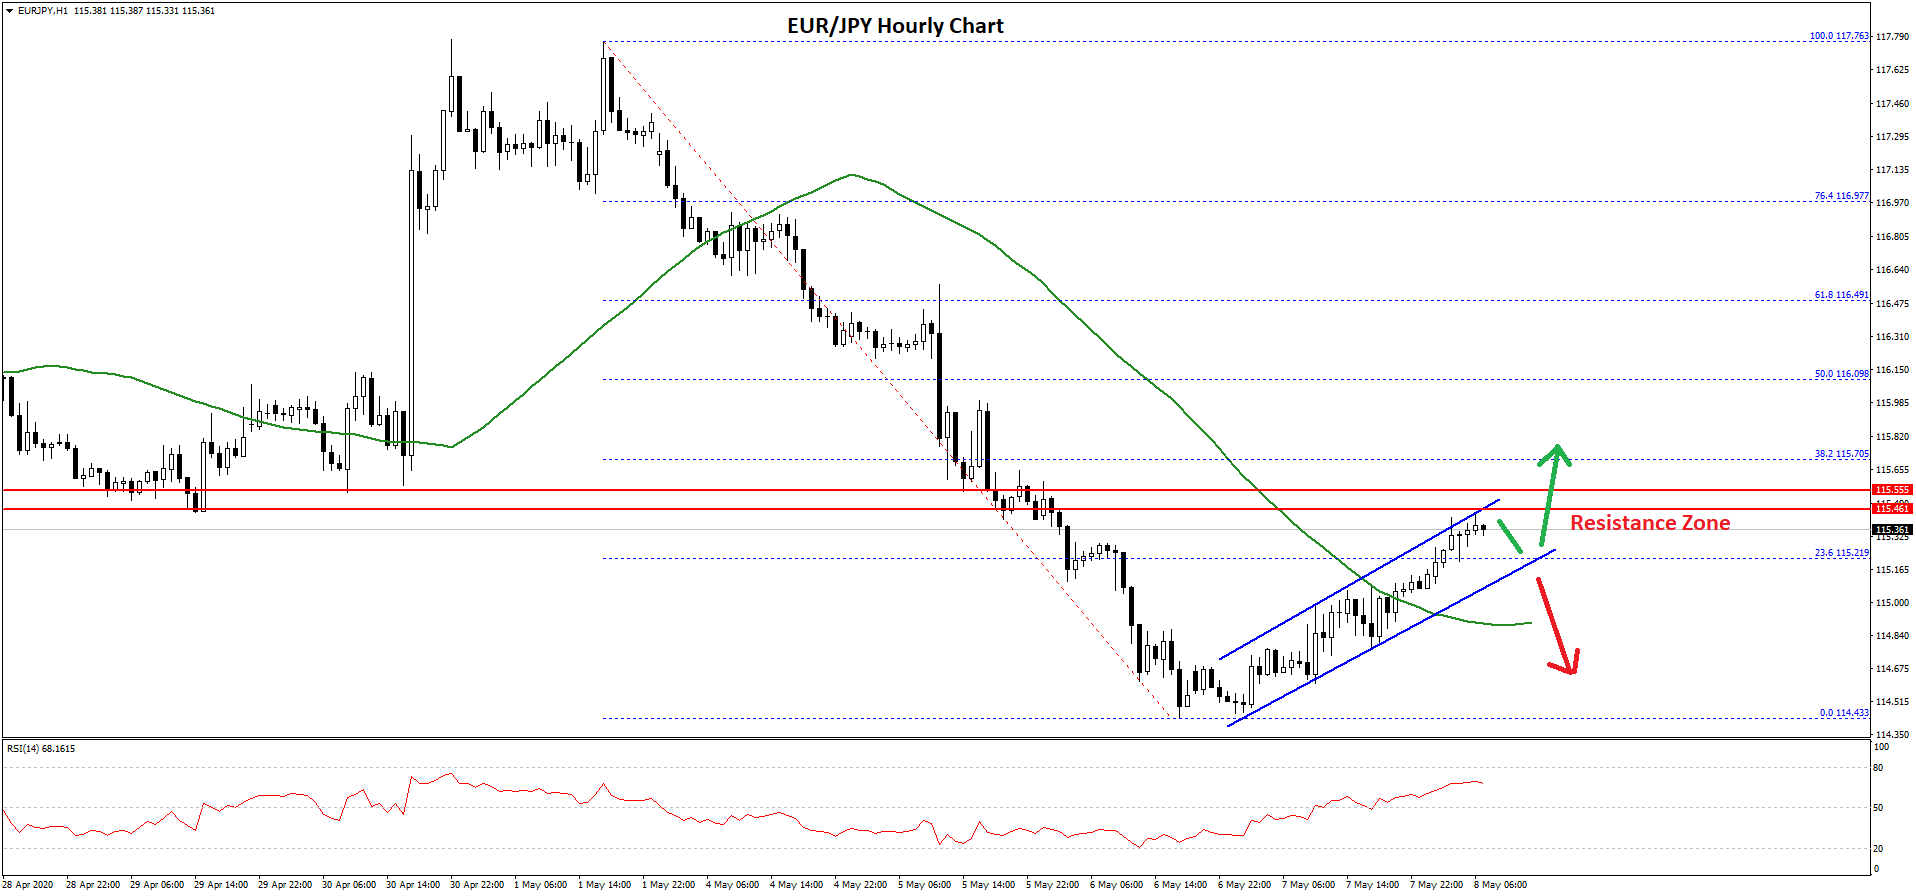
There was a break above the 115.00 resistance and the 50 hourly simple moving average. The pair broke the 23.6% Fib retracement level of the downward move from the 117.76 high to 114.43 low.
It seems like there is a rising channel forming with resistance near 115.55 on the hourly chart of EUR/JPY. The channel resistance is close to the previous breakdown zone at 115.50.
The next key resistance is near the 116.00 level or the 50% Fib retracement level of the downward move from the 117.76 high to 114.43 low. Any further gains could open the doors for a decent increase in the coming sessions.
Conversely, the pair could fail to continue above the 115.50 and 115.55 resistance levels. A downside break below the channel support at 115.20 may perhaps open the doors for a larger decline towards the 114.60 and 114.50 levels.
GBP/JPY Technical Analysis
The British Pound also followed a similar pattern declined heavily from well above the 135.00 level against the Japanese Yen. The GBP/JPY pair broke many supports near the 133.20 and 132.50 levels.
Moreover, the price settled below the 132.00 level and the 50 hourly simple moving average. The pair traded to a new monthly low at 130.65 and it is currently correcting higher.
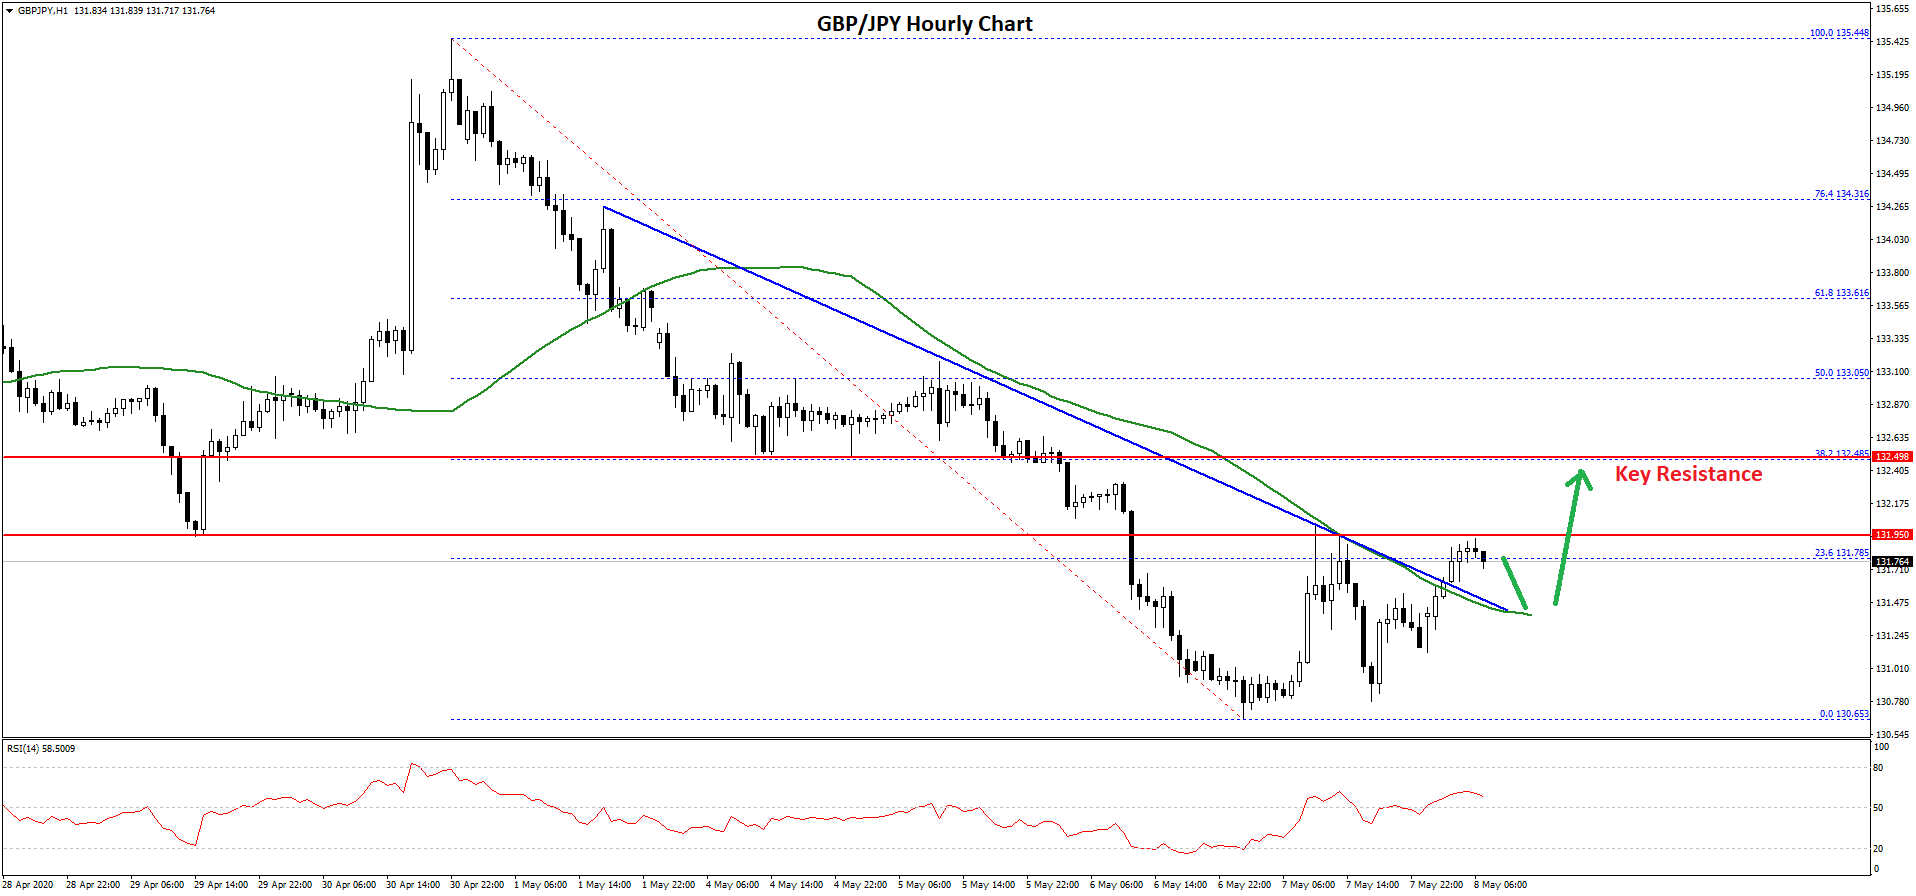
There was a break above the 131.40 level and the 50 hourly simple moving average. Besides, there was a break above a key bearish trend line with resistance near 131.60 on the hourly chart.
The pair is now trading near the 23.6% Fib retracement level of the downward move from the 135.44 high to 130.65 low. On the upside, there is a major resistance forming near the 132.00 level (the recent breakdown zone).
Above the 132.00 resistance, the pair could test the 132.50 resistance. Any further gains could lead the pair towards the 133.00 level or the 50% Fib retracement level of the downward move from the 135.44 high to 130.65 low.
Conversely, the GBP/JPY pair might struggle to continue above the 132.00 and 132.50 resistance levels. An initial support on the downside is near the 131.40 level, below which the pair could resume its decline towards the 130.50 and 130.0 support levels.
Trade over 50 forex markets 24 hours a day with FXOpen. Take advantage of low commissions, deep liquidity, and spreads from 0.0 pips. Open your FXOpen account now or learn more about trading forex with FXOpen.
This article represents the opinion of the Companies operating under the FXOpen brand only. It is not to be construed as an offer, solicitation, or recommendation with respect to products and services provided by the Companies operating under the FXOpen brand, nor is it to be considered financial advice.
Latest from Forex Analysis
Latest articles

Weekly Market Wrap With Gary Thomson: UK100, USD, GOLD, OIL
Get the latest scoop on the week's hottest headlines, all in one convenient video. Join Gary Thomson, the COO of FXOpen UK, as he breaks down the most significant news reports and shares his expert insights.
- UK100 Share Index Rises

What Is a Darvas Box Theory and How Does It Work in Trading?
The Darvas Box Theory, pioneered by Nicolas Darvas in the 1950s, has transcended its stock market origins to become a valuable tool for forex traders. This method leverages specific price movements and patterns, known as the Darvas Box, to track

NFLX Stock Price Falls Despite Subscriber Growth
Yesterday, after the close of the main trading session on the stock market, Netflix reported to investors for the 1st quarter of 2024.
The report turned out better than expected:
→ earnings per share: actual = USD 5.28, forecast = USD 4.