


FXOpen
The Euro and British Pound started a strong decline against the Japanese Yen. EUR/JPY is facing resistance near 122.65 and GBP/JPY could struggle to clear 139.20.
Important Takeaways for EUR/JPY and GBP/JPY
- The Euro started a sharp decline below the 123.20 and 122.65 supports against the Japanese Yen.
- There is a key connecting bearish trend line forming with resistance near 122.70 on the hourly chart of EUR/JPY.
- GBP/JPY declined heavily and broke the main 140.00 and 139.55 support levels.
- The pair recently recovered above a major bearish trend line with resistance near 138.75 on the hourly chart.
EUR/JPY Technical Analysis
After trading as high as 123.73, the Euro started a major decline against the Japanese Yen. The EUR/JPY pair broke many important supports such as 123.50, 123.20 and 122.65 to move into a bearish zone.
The pair even settled below the 122.65 support and the 50 hourly simple moving average. A new weekly low was formed at 122.14 on FXOpen and the pair recently started an upside correction.
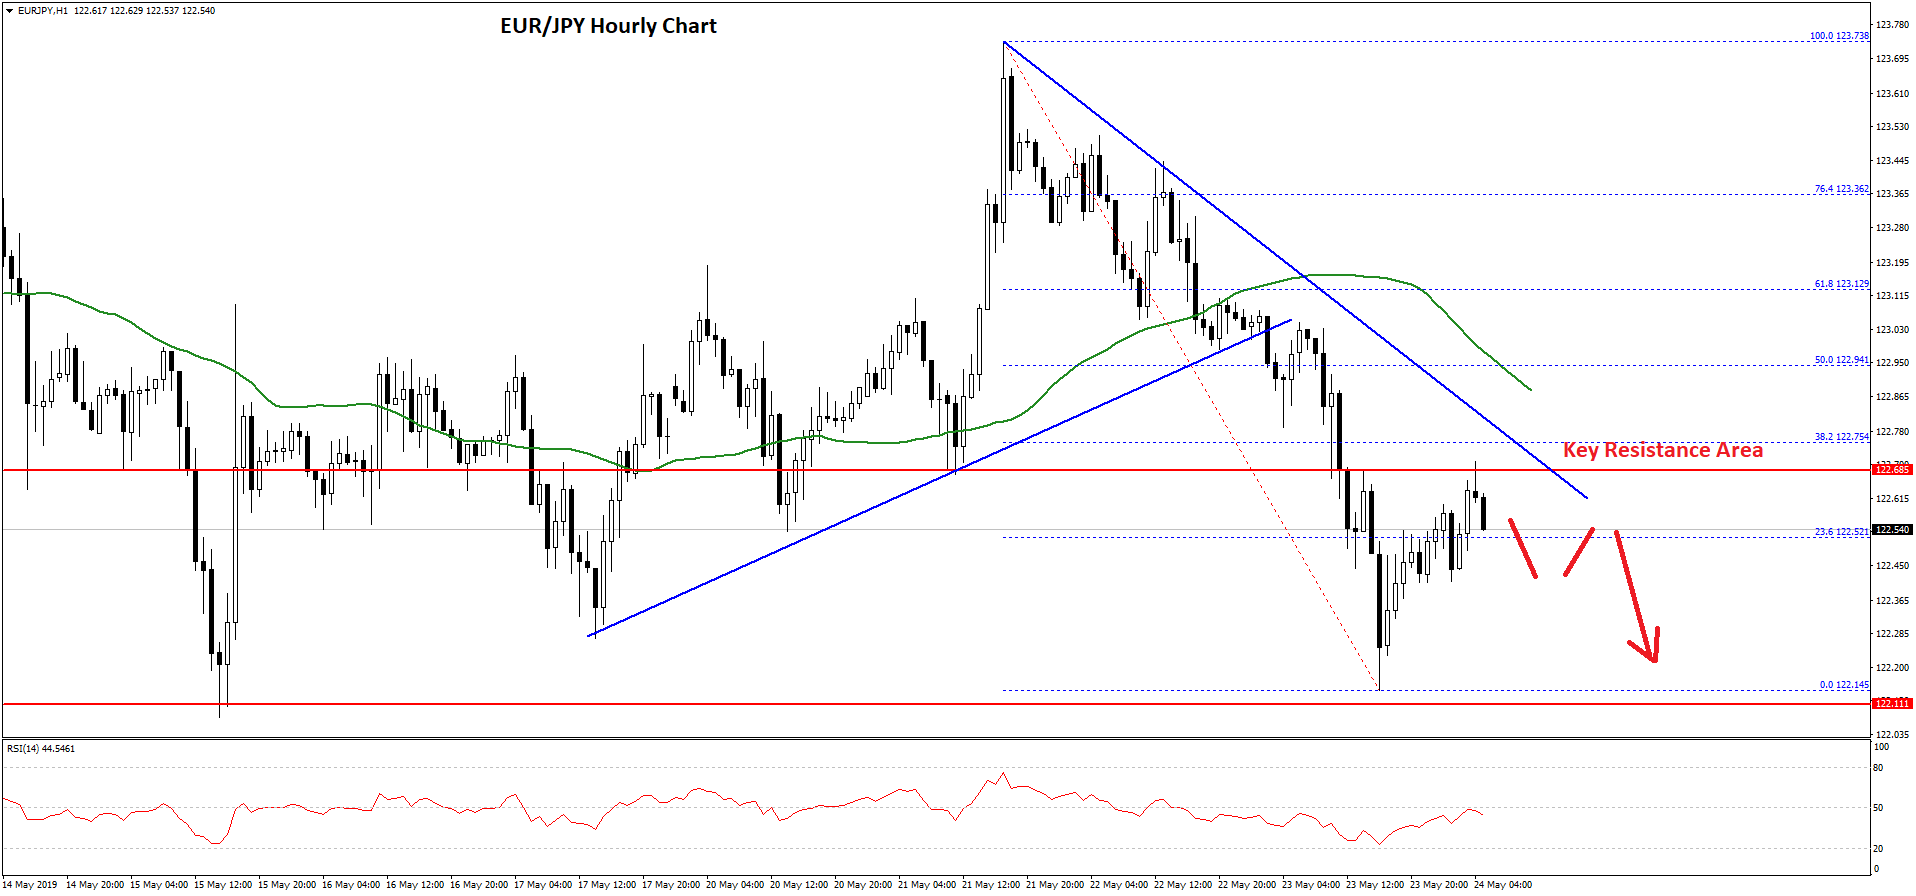
It climbed above the 122.40 level and the 23.6% Fib retracement level of the last decline from the 123.73 high to 122.14 low. However, the pair ran into a major resistance area near the 122.65 and 122.70 levels.
Besides, there is a key connecting bearish trend line forming with resistance near 122.70 on the hourly chart of EUR/JPY. The 38.2% Fib retracement level of the last decline from the 123.73 high to 122.14 low is also near the trend line.
Therefore, it won’t be easy for the bulls to gain momentum above the 122.70 resistance area. If they succeed, the pair could recover above the 122.80 level and the 50 hourly SMA.
The next key resistance is near the 123.20 level. Conversely, if there is no upside break above 122.70, the EUR/JPY pair could resume its decline. An immediate support is near the 122.40 level, below which the pair might decline towards the 122.00 level.
GBP/JPY Technical Analysis
There was a strong increase in selling pressure on the British Pound, resulting in a sharp drop below 140.20 against the Japanese Yen. The GBP/JPY pair declined heavily and traded below the 140.00 and 139.50 support levels.
The pair even settled below the 139.00 level and the 50 hourly simple moving average. It traded as low as 138.52 and the pair is currently correcting higher.
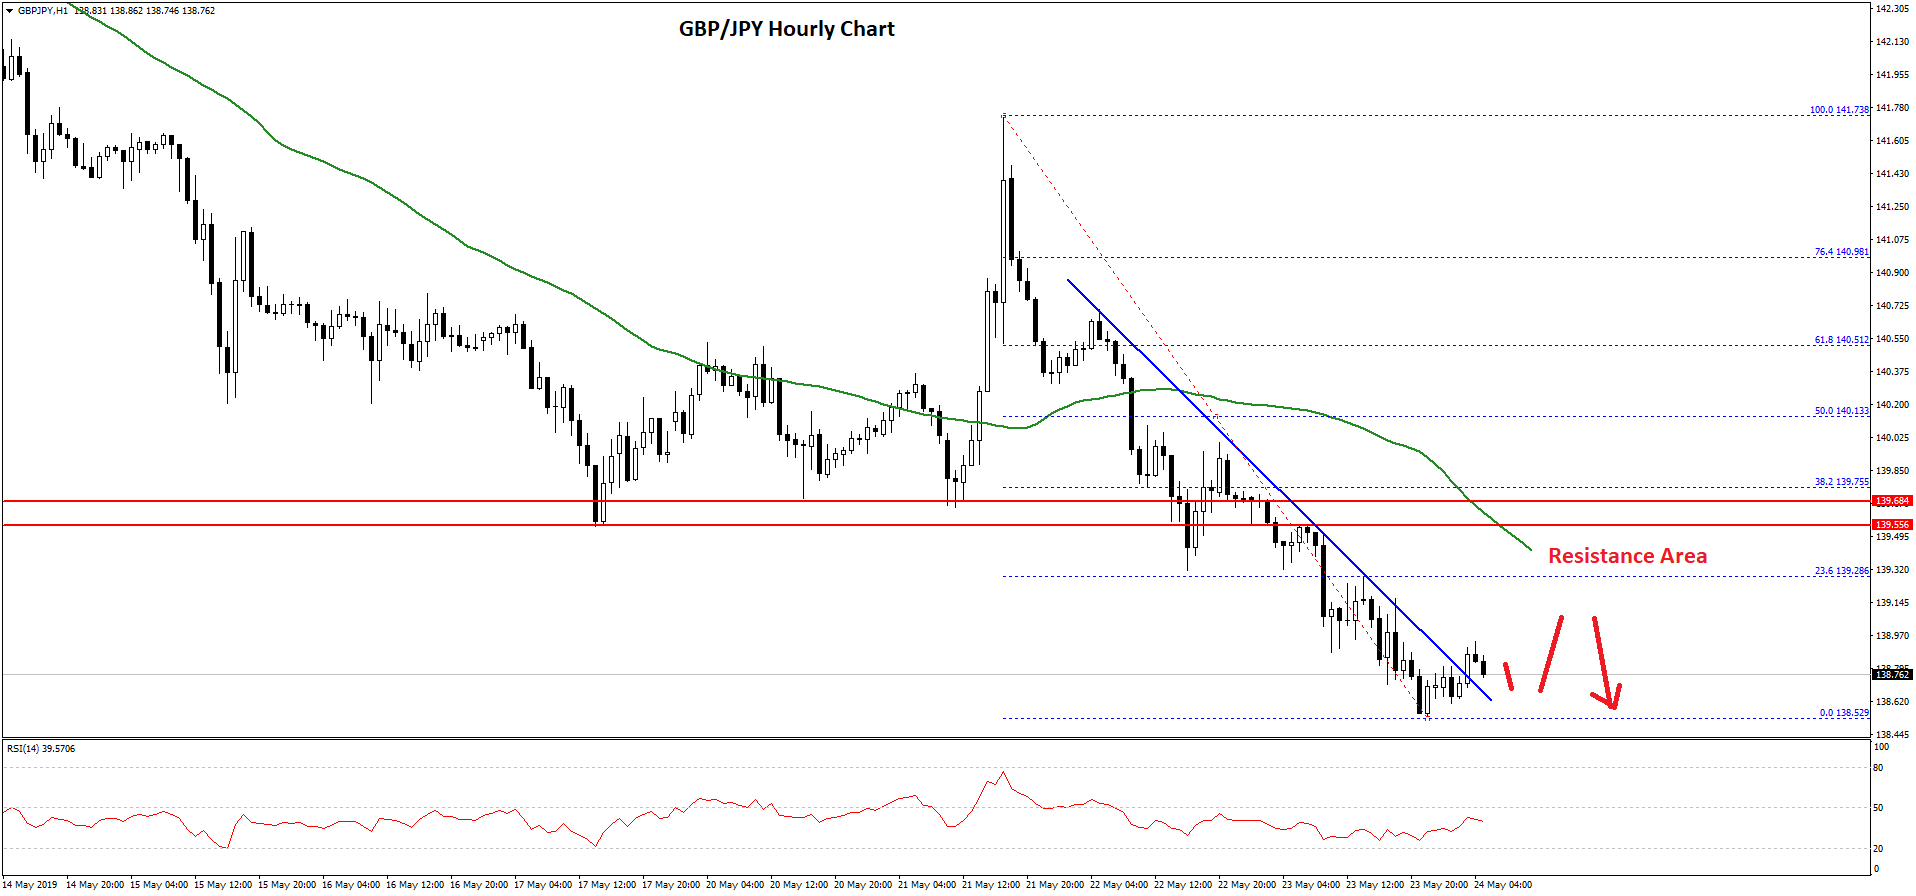
It recently traded above a major bearish trend line with resistance near 138.75 on the hourly chart. However, the bulls failed to gain momentum above the 139.00 level.
On the upside, there are many resistances formed near the 139.00 and 139.20 level. Besides, the 23.6% Fib retracement level of the last decline from the 141.73 high to 138.52 low is also near the 139.28 level to prevent gains.
Moreover, the 50 hourly simple moving average is also positioned near the 139.40 level. However, the main resistance is near the 139.55 level (the previous support area), and the 38.2% Fib retracement level of the last decline from the 141.73 high to 138.52 low at 139.75.
Therefore, if the GBP/JPY pair corrects higher in the short term, it could face a lot of hurdles near the 139.00, 139.20 and 139.55 levels. On the downside, a break below the recent low at 138.52 could trigger heavy losses.
Trade over 50 forex markets 24 hours a day with FXOpen. Take advantage of low commissions, deep liquidity, and spreads from 0.0 pips. Open your FXOpen account now or learn more about trading forex with FXOpen.
This article represents the opinion of the Companies operating under the FXOpen brand only. It is not to be construed as an offer, solicitation, or recommendation with respect to products and services provided by the Companies operating under the FXOpen brand, nor is it to be considered financial advice.
Stay ahead of the market!
Subscribe now to our mailing list and receive the latest market news and insights delivered directly to your inbox.


Latest articles


XBR/USD Chart Analysis: Price Rebounds from a Seven-Week Low
On 1 December, we outlined a descending channel on the XBR/USD chart and noted that the bearish trend was driven by fading geopolitical risks. Indeed, hopes for an end to the war in Ukraine—along with the possibility of

Silver Price Hits Historic Record Around $64
On 27 November, we suggested that silver was preparing to challenge its all-time high. Since then (marked with the orange arrow), XAG/USD has risen by roughly 18%, breaking above the psychological $60-per-ounce threshold for the first time in history.