


ETHUSD and LTCUSD Technical Analysis – 27th JAN, 2022
FXOpen

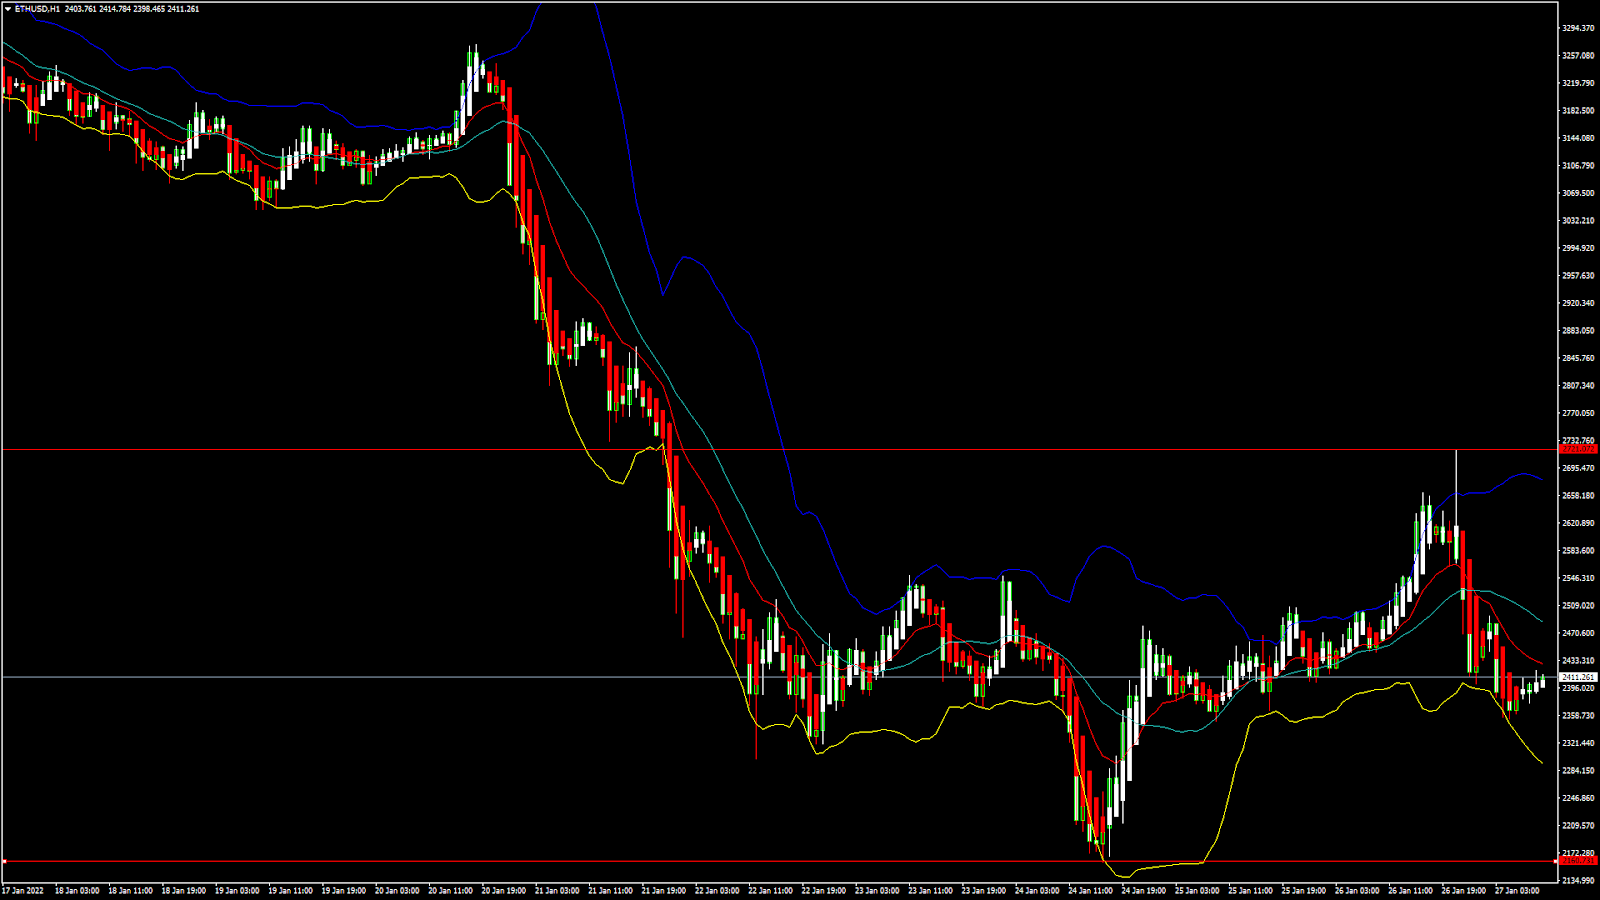
ETHUSD – Bearish Engulfing Pattern Below $2700
Ethereum started a major bearish correction from its highs of 3268 reached on 20th January. We can see that after a mild bullish correction wave, the bearish trend is back which continues to push down the prices of Ethereum below the $2500 handle in the European Trading session today.
ETHUSD touched an intraday low of 2355 in the Asian trading session today after which we can see some consolidation in its prices above the $2300 handle.
We can clearly see a Bearish Engulfing Pattern below the $2700 handle which is a bearish pattern and signifies a potential shift in the market direction towards a Downtrend.
ETH is now trading just above its Pivot levels of 2403 and is moving in a Consolidation Channel. The price of ETHUSD is now testing its Classic support levels of 2358 and Fibonacci support levels of 2392 after which the path towards 2200 will get cleared.
Relative Strength Index is at 41 indicating a WEAK demand for the Ethereum and the continuation of the Selling pressure in the markets.
Most of the of the Technical indicators are giving a STRONG SELL Signal.
ETH is now trading Below its both the 100 Hourly and 200 Hourly Simple Moving Averages.
- Ether Bearish momentum is seen below the $2700 mark.
- Short-term range appears to be BEARISH.
- Ultimate Oscillator is indicating a NEUTRAL market.
- Average True Range is indicating LESS Market Volatility.
Ether Bearish Momentum seen Below $2700
ETHUSD continues to move into a Mild Bearish channel below the $2700 handle in the European Trading session today.
Average Directional Change is indicating a NEUTRAL market, and the overall sentiment is shifted towards the Bearish market.
The heavy selling pressure in Ethereum and its subsequent liquidation by the long-term investors is due to the fear of a Russian Attack on Ukraine and its broader implications on the Crypto markets.
We are now looking at the key support levels of $2300 which if broken would push down the prices of Ethereum towards the $2200 handle.
ETH has lost -2.71% with a price change of -66.95$ in the past 24hrs and has a trading volume of 22.749 Billion USD.
We can see an Increase of 42.78% in the total trading volume in last 24 hrs. which is due to the heavy selling seen after the bullish momentum failed.
The Week Ahead
Ethereum is now approaching its important support levels of $2300 which will decide whether we will see a Bullish reversal in the markets.
If the prices of ETHUSD continue to remain above the $2300 handle as we can see today, it will signify a Bullish reversal with an Upside target of $2500 to $2800 in the next week.
The immediate short-term outlook for the Ether has turned as BEARISH, the Medium term outlook is NEUTRAL, and the Long term outlook for Ether is BULLISH towards the $3000 handle.
We have detected an MA 5 crossover pattern above 2398 levels which signifies a Bullish Trend reversal in the short term.
In this week Ether is expected to move in a range between the $2300 and $2600 and in the next week Ether is expected to trade at levels above $2600.
Technical Indicators:
Rate of Price Change: It is at -7.782 indicating a SELL.
STOCH (9,6): It is at 23.42 indicating a SELL.
Moving Averages Convergence Divergence (12,26): It is at -24.08 indicating a SELL.
STOCHRSI (14): It is at 25.04 indicating a SELL.
LTCUSD – Bearish Engulfing Pattern Below $116
Litecoin touched a high of 142.52 on 20th January, after which the bearish momentum continues which is pushing down its prices below the $110 handle in the European Trading session today.
LTUCSD touched a low of 98.09 on 24th January, after which it entered into a consolidation channel above the $100 levels.
LTCUSD touched an Intraday low of 103.24 after which we can see some consolidation in its levels above the $105 handle in the European Trading session today.
We can clearly see a Bearish Engulfing Pattern below the $116 handle which is a bearish pattern and signifies a potential shift in the market direction towards a Downtrend.
Litecoin is now trading below its 100 hourly Simple moving averages and 200 hourly Exponential moving averages. The price of LTCUSD is just below its Pivot levels of 106.33
Relative Strength Index is at 46 indicating a NEUTRAL market and a shift towards the Consolidation phase.
Most of the Moving Averages are giving a SELL Signal.
The Short-Term outlook for the Litecoin has turned BEARISH.
- Some of the Major Technical Indicators are giving a SELL Signal.
- Bearish Momentum is seen below the $116 levels.
- Commodity Channel Index is indicating a NEUTRAL market.
- Average True Range is indicating LESS Market Volatility.
Litecoin Bearish Momentum seen Below $116

The price of Litecoin continues to decline against the US Dollar and is now trading below the $110 handle.
We can see a move towards the consolidation phase which is expected to keep its prices above the $100 handle.
The price of LTCUSD is now facing its Classic Support levels of 104.16 and Fibonacci Support levels of 105.76 after which the path towards $102 will get cleared.
In the last 24hrs LTCUSD is Down by -1.81% by -1.97$ and has a 24hr trading volume of 1.106 Billion USD.
Litecoin trading volume has increased by 27.75% as compared to yesterday due to the heavy selling pressure present in the markets.
Due to the recent decline in the levels of Litecoin its Total market capitalization has come down to 7.393 Billion USD.
The Week Ahead
Litecoin has already entered into a consolidation channel above the $100 handle. If the prices of LTCUSD continue to remain above these levels then we can see a Bullish reversal in the markets in the next week.
We have detected an MA 10 and MA 5 Crossover pattern at the levels of 105.64 which is a Bullish reversal pattern in the short-term range.
The short-term outlook for Litecoin has turned as BEARISH, the medium-term outlook is NEUTRAL, and the long-term outlook is BULLISH at present market conditions.
In this week we are looking at levels of $110 to $115 and in the next week Litecoin is expected to trade at levels above $115.
Technical Indicators:
Moving Averages Convergence Divergence (12,26): It is at -0.779 indicating a SELL.
Williams Percent Range: It is at -74.24 indicating a SELL.
Rate of Price Change: It is at -4.476 indicating a SELL.
STOCH (9,6): It is at 43.91 indicating a SELL.
FXOpen offers the world's most popular cryptocurrency CFDs*, including Bitcoin and Ethereum. Floating spreads, 1:2 leverage — at your service (additional fees may apply). Open your trading account now or learn more about crypto CFD trading with FXOpen.
*Important: At FXOpen UK, Cryptocurrency trading via CFDs is only available to our Professional clients. They are not available for trading by Retail clients. To find out more information about how this may affect you, please get in touch with our team.
This article represents the opinion of the Companies operating under the FXOpen brand only. It is not to be construed as an offer, solicitation, or recommendation with respect to products and services provided by the Companies operating under the FXOpen brand, nor is it to be considered financial advice.
Stay ahead of the market!
Subscribe now to our mailing list and receive the latest market news and insights delivered directly to your inbox.


Latest articles

AUD/USD: Will the RBA Be Able to Keep Its Currency Strong?
As the chart shows, AUD/USD has entered a distinctly bearish phase in recent weeks, reflecting the broader consolidation — and in some cases outright weakness — that the US dollar has begun imposing across most major currency pairs.
Fundamental Analysis
The

AUD/CAD: Pair Remains Range-Bound Amid Interest Rate Divergence
The key macroeconomic factor for AUD/CAD remains the divergence in monetary policy between the two central banks. After three consecutive rate hikes since the beginning of the year, the Reserve Bank of Australia left its cash rate unchanged at

Brent Crude Oil Analysis: Stabilisation or Simply a Pause?
Over the past few weeks, financial markets have been more focused than ever on developments surrounding the Strait of Hormuz — a critical waterway at the centre of ongoing US-Iran negotiations. The back-and-forth of diplomatic headlines has injected significant volatility into