


ETHUSD and LTCUSD Technical Analysis – 14th APR, 2022
FXOpen

ETHUSD: Double Bottom Pattern Above $2,900
Ethereum failed to continue its bullish momentum last week, and started to decline after touching a high of 3,299 on April 8th.
It touched an intraday low of 3,093 in the Asian trading session, and an intraday high of 3,142 in today’s European trading session.
We can clearly see a double bottom pattern above the $2,900 handle which is a bullish pattern and signifies the end of a bearish phase and the start of a bullish phase in the markets.
ETH is now trading just above its pivot level of 3,111 and moving in a mildly bullish channel. The price of ETHUSD is now testing its classic resistance level of 3,120 and Fibonacci resistance level of 3,128, after which the path towards 3,200 will get cleared.
The relative strength index is at 59 indicating a STRONG demand for Ethereum and the continuation of the bullish trend.
Both the average directional change and commodity channel index are indicating a neutral level which means that the prices are due to enter into a consolidation phase.
Most of the technical indicators are giving a STRONG BUY market signal.
Most of the moving averages are giving a STRONG BUY signal, and we are now looking at the levels of $3,300 to $3,350 in the short-term range.
ETH is now trading below both the 100 hourly and exponential moving averages.
- Bullish reversal seen in Ether above the $2,900 mark
- The short-term range appears to be mildly BULLISH
- The daily RSI is below 50 at 48 indicating a NEUTRAL market
- The average true range is indicating LESSER market volatility
Ether: Bullish Reversal Seen Above $2,900

ETHUSD is now moving in a mildly bullish channel with the price trading above the $3,100 handle in the European trading session today.
Ethereum is now slowly preparing for its next move against the US dollar. We can see the formation of a contraction triangle pattern, which shows price building energy, and we can see the A-C and B-D trendlines.
ETHUSD is now facing its immediate resistance levels of $3,128 and $3,300, after which we will see a linear progression towards the level of $3,400.
The key support levels to watch are $2,906 and $3,034, and the prices of ETHUSD need to remain above these levels for the bullish trend to continue.
ETH has gained 2.05% with a price change of $62.64 in the past 24hrs and has a trading volume of 15.476 billion USD.
We can see a decrease of 19.10% in the total trading volume in the last 24 hrs, which appears to be normal.
The Week Ahead
Last week, we saw Ethereum decline from its highs of 3,299 to the lows of 2,951, but now we can see that the prices have entered a consolidation phase above the level of 3,000.
If the price of ETHUSD remains above $3,000, we may see a linear progression towards the levels of $3,200 and $3,350 this week.
The immediate short-term outlook for Ether has turned mildly BULLISH; the medium-term outlook has turned neutral; and the long-term outlook for Ether is NEUTRAL in present market conditions.
This week, Ether is expected to move in a range between $3,100 and $3,300, and next week, it is expected to enter a consolidation phase above $3,300.
Technical Indicators:
The Williams percent range: at -44.92 indicating a BUY
The moving averages convergence divergence (12,26): at 15.85 indicating a BUY
The rate of price change: at 0.332 indicating a BUY
Bull/Bear power (13-day): at 16.23 indicating a BUY
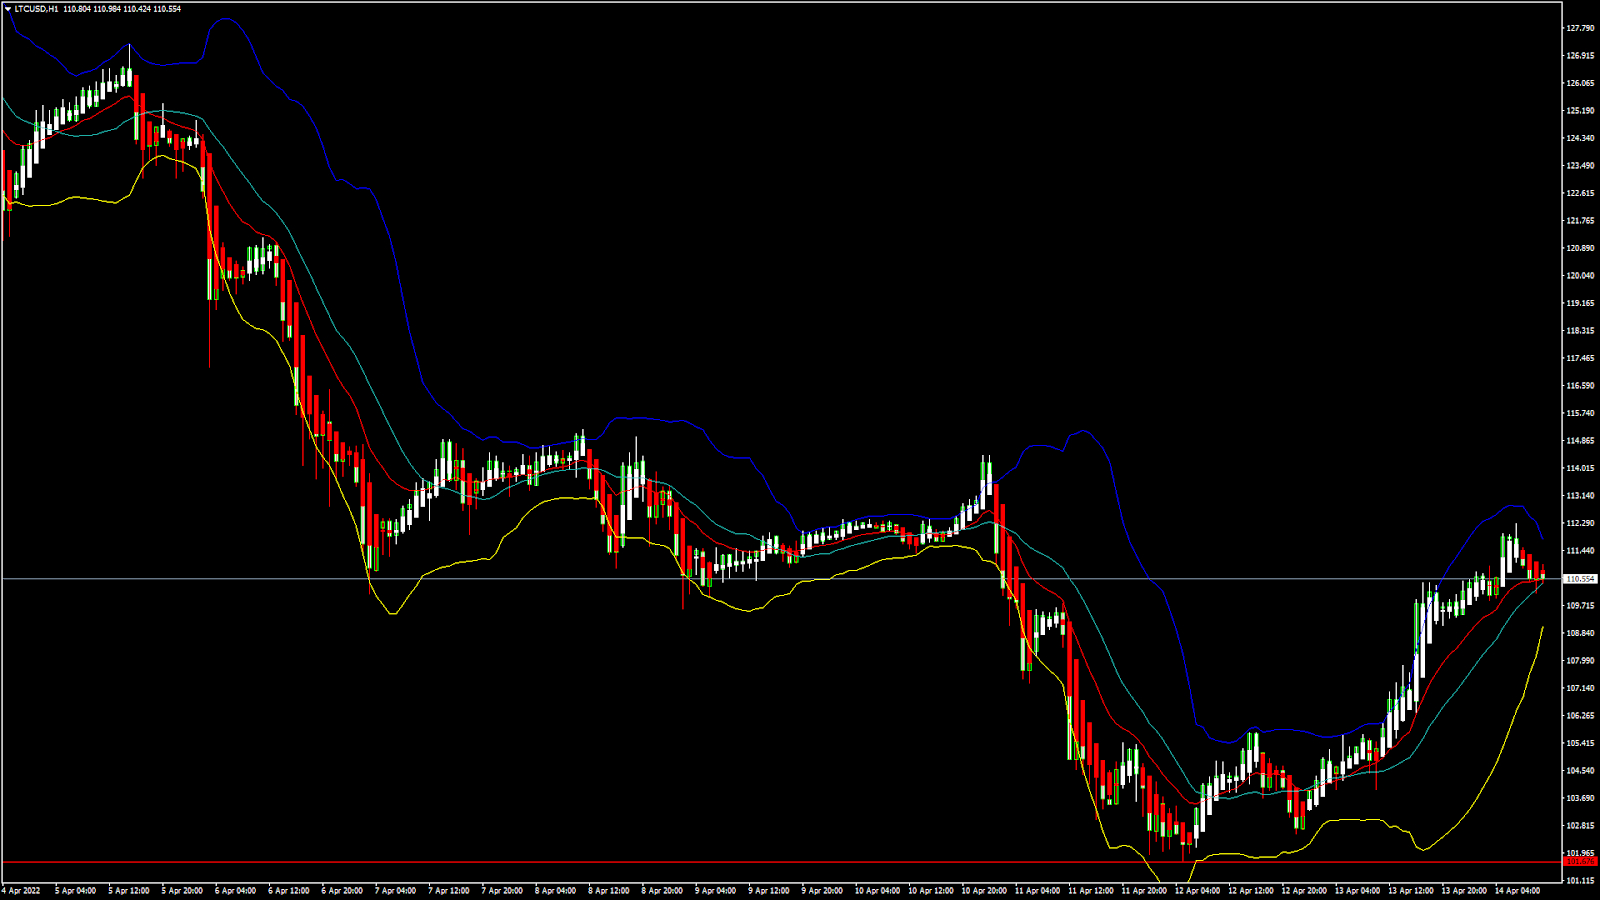
LTCUSD: Bullish Engulfing Pattern Above $101
Litecoin was unable to sustain its bullish momentum last week, and after touching a high of 129.39 on April 4th, started to decline touching a low of 101.97 on April 12th.
Now the price of Litecoin has stabilized and entered a mildly bullish channel above the handle of $101.
The bullish momentum continues today pushing the prices above the $110 handle in the European trading session.
LTUCSD touched an intraday low of 109.87 after which we may see a move towards the consolidation phase.
We can clearly see a bullish engulfing pattern above $101 which is a bullish pattern and signifies the end of a bearish phase and the start of a bullish phase.
Litecoin is now trading above its 100 hourly simple moving average and exponential moving averages. The price of LTCUSD is just above its pivot level of 110.60.
The relative strength index is at 61 indicating a STRONG demand for Litecoin, and the continuation of the bullish momentum in the markets.
The price of Litecoin continues to remain above most of the moving averages, which are now giving a NEUTRAL signal at current market levels of 110.70.
Both the Stoch and commodity channel index are indicating a NEUTRAL level, which means that the prices are expected to remain in the consolidation phase now.
The short-term outlook for Litecoin has turned mildly BULLISH.
- Some of the technical indicators are giving a BUY signal
- Bullish reversal is seen in Litecoin above $101
- The StochRSI is indicating an OVERBOUGHT level
- The average true range is indicating LESSER market volatility
Litecoin: Bullish Reversal Seen Above $101
The price of Litecoin has corrected upwards after touching a low of $102, and a move towards the consolidation phase is observed. If this bullish scenario holds, we may see the price of Litecoin touch the level of $115 this week.
The ascending trendline formation is in place which further validates the continuation of the bullish phase in the markets.
The price of LTCUSD is now facing its classic resistance level of 111.10 and Fibonacci support level of 112.63, after which the path towards $115 will get cleared.
The daily RSI is printing at 44 which also indicates a weak demand for Litecoin in the medium term.
LTC has gained 4.95% with a price change of 5.22$ in the past 24hrs, and has a trading volume of 0.842 billion USD.
Litecoin trading volume has increased by 34.13% compared to yesterday due to more buyers entering the markets.
The Week Ahead
This week, we are looking at the support level of $107 and the continuation of the bullish trend in the markets. If the price remains above these levels, we may see more bullish moves next week.
The short-term outlook for Litecoin has turned mildly BULLISH; the medium-term outlook is NEUTRAL; and the long-term outlook is NEUTRAL at present market conditions.
This week, we are looking at levels of $112 to $115, and next week, Litecoin is expected to consolidate at levels above $115.
Technical Indicators:
The relative strength index (14-day): at 61.22 indicating a BUY
The moving averages convergence divergence (12,26): at 1.168 indicating a BUY
The rate of price change: at 0.820 indicating a BUY
Bull/Bear power (13-day): at 0.4040 indicating a BUY
FXOpen offers the world's most popular cryptocurrency CFDs*, including Bitcoin and Ethereum. Floating spreads, 1:2 leverage — at your service (additional fees may apply). Open your trading account now or learn more about crypto CFD trading with FXOpen.
*Important: At FXOpen UK, Cryptocurrency trading via CFDs is only available to our Professional clients. They are not available for trading by Retail clients. To find out more information about how this may affect you, please get in touch with our team.
This article represents the opinion of the Companies operating under the FXOpen brand only. It is not to be construed as an offer, solicitation, or recommendation with respect to products and services provided by the Companies operating under the FXOpen brand, nor is it to be considered financial advice.
Stay ahead of the market!
Subscribe now to our mailing list and receive the latest market news and insights delivered directly to your inbox.


Latest articles

AUD/USD: Will the RBA Be Able to Keep Its Currency Strong?
As the chart shows, AUD/USD has entered a distinctly bearish phase in recent weeks, reflecting the broader consolidation — and in some cases outright weakness — that the US dollar has begun imposing across most major currency pairs.
Fundamental Analysis
The

AUD/CAD: Pair Remains Range-Bound Amid Interest Rate Divergence
The key macroeconomic factor for AUD/CAD remains the divergence in monetary policy between the two central banks. After three consecutive rate hikes since the beginning of the year, the Reserve Bank of Australia left its cash rate unchanged at

Brent Crude Oil Analysis: Stabilisation or Simply a Pause?
Over the past few weeks, financial markets have been more focused than ever on developments surrounding the Strait of Hormuz — a critical waterway at the centre of ongoing US-Iran negotiations. The back-and-forth of diplomatic headlines has injected significant volatility into