


ETHUSD and LTCUSD Technical Analysis – 10th MAR, 2022
FXOpen

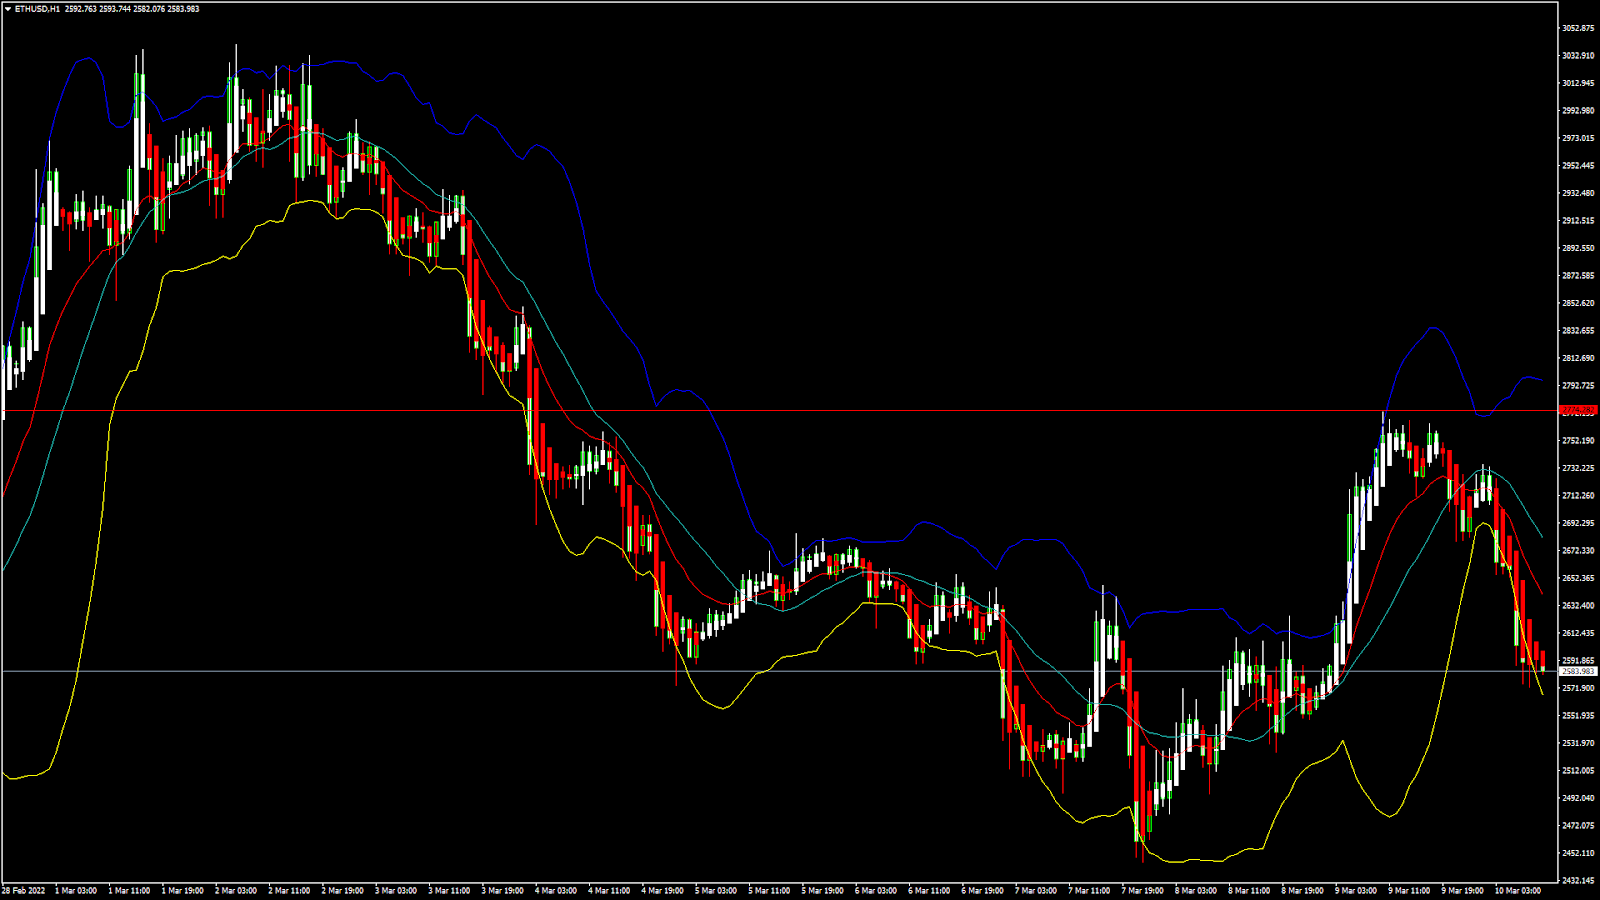
ETHUSD: Head and Shoulders Pattern Below $2,700
Ethereum continued to move in a bearish phase last week, having touched a low of $2,448 on March 7th, after which the prices started to consolidate above the level of $2,500.
We can see ETHUSD moving in a bearish momentum because of the Russia-Ukraine war and its effects on the global investor sentiments.
Despite the fact that some correction was seen in the USD, the medium-term outlook for Ethereum remains bearish with a downside projection of $2,200.
We can clearly see a head-and-shoulders pattern below the $2,700 handle which is a bearish pattern signifying the end of a bullish phase and the start of a bearish phase in the markets.
ETH is now trading just below its pivot level of $2,588 and is moving in a bearish channel. The price of ETHUSD is now testing its classic support level of $2,558, and Fibonacci support level of $2,580 after which the path towards $2,300 will get cleared.
The relative strength index is at 34 indicating a WEAKER demand for Ethereum, as well as the continuation of the selling pressure in the markets.
All of the technical indicators are giving a STRONG SELL market signal.
All of the moving averages are giving a STRONG SELL signal, and we are now looking at the levels of $2300 to $2200 in the short-term range.
ETH is now trading below both its 100 hourly and 200 hourly simple moving averages.
- A bearish reversal seen below the $2700 mark in Eth
- Short-term range appears to be strongly BEARISH
- The daily RSI is below 50 at 44 indicating a BEARISH market
- The average true range is indicating LESSER market volatility
Ether: Bearish Momentum Continues Below $2,700
ETHUSD is now moving in a strongly bearish momentum, with the prices trading below the $2,600 handle in the European trading session today.
Both the Stoch and StochRSI are indicating an OVERSOLD market, which means that a pullback in the levels of Ethereum is expected soon.
The Ethereum bulls have retracted, and we can see that the selling pressure has resumed which is expected to push down the prices below the $2,500 handle.
The prices of ETHUSD need to remain above $2,200 for any bullish reversal in the markets.
At present, we are looking for the immediate target of $2,300 after which it is expected to enter into a consolidation and correction phase.
This week, the key support level to watch is $2,200, and the key resistance level is $2,700.
ETH has declined -5.24% with a price change of -143.26$ in the past 24hrs, and has a trading volume of 13.621 billion USD.
We can see an Increase of 16.69% in the total trading volume in the last 24 hrs, which appears to be normal.
The Week Ahead
Ethereum has already exhausted its consolidation channel and is now moving into its next bearish phase towards the level of $2,300.
The ongoing Russia-Ukraine war crisis is continuing to affect the prices of Ethereum, as new investors are not willing to enter into the market because of the global crisis scenario and the waning demand in the global cryptocurrency markets.
If the prices of ETHUSD continue to remain above $2,200 this week, we can expect a bullish reversal next week.
The immediate short-term outlook for Ether has turned strongly BEARISH; the medium-term outlook has turned bearish; and the long-term outlook for Ether is NEUTRAL in present market conditions.
This week. Ether is expected to move in a range between $2,200 and $2,700, and next week, it is expected to enter into a consolidation phase above $2,500.
Technical Indicators:
The moving averages convergence divergence (12,26): at -16.78 indicating a SELL
The commodity channel index (14-day): at -117.12 indicating a SELL
The rate of price change: at -4.37 indicating a SELL
The average directional change (14-day): at 45.85 indicating a SELL
LTCUSD: Shooting Star Pattern Below $109
Litecoin moved in a bearish phase last week when it touched a low of 96.22 on March 7th, after which we can see a move towards a consolidation phase above $100.
The selling pressure continues this week, and we can see that the price of LTCUSD broke the level of 101 in the European trading session today.
The Russia-Ukraine war is driving down the prices of Litecoin as the global investor’s confidence is waning, and new investors are not coming into the markets.
LTUCSD touched an intraday high of 106.93 in the early Asian trading session, and an intraday low of 100.27 in the European trading session today.
We can clearly see a shooting star pattern below the $109 handle, which is a bearish pattern signifying the end of a bullish phase and the start of a strongly bearish phase.
Litecoin is now trading below its 100 hourly simple moving average and 200 hourly exponential moving average. The price of LTCUSD is just below its pivot levels of 101.36.
The relative strength index is at 27 indicating a WEAKER demand for Litecoin, and the continuation of a bearish momentum in the markets.
The prices of Litecoin continue to remain below all of the moving averages, which are now giving a STRONG SELL signal at current market levels of 101.15.
Both the Williams percent range and StochRSI is indicating an oversold market which means that we can expect a short-term upwards correction in its prices.
The short-term outlook for Litecoin has turned strongly BEARISH.
- All of the technical indicators are giving a STRONG SELL signal
- A bearish reversal is seen below the level of $109
- The Williams percent range is indicating an OVERSOLD market
- The average true range is indicating HIGHER market volatility
Litecoin: Bearish Momentum Continues Below $109

The price of Litecoin continues to move in a strong bearish channel below the $109 handle after the failed attempt to clear its resistance zone located at $110.
The upside movement we saw in Litecoin was capped at $109, and under present market conditions we can see a progression of the bearish trend towards $100.
We can see a descending trendline in the daily time frame, and possible targets are $98 and $95 in the medium-term range.
The price of LTCUSD is now facing its classic support level of 92.60, and Fibonacci support level of 94.55, after which the path towards $90 will get cleared.
The daily RSI is printing at 32 which also indicates a weak demand for Litecoin in the medium-term.
LTC has declined -4.97% with a price change of -5.30$ in the past 24hrs, and has a trading volume of 0.8011 billion USD.
Litecoin trading volume has decreased by 1.18% as compared to yesterday, which appears to be normal.
The Week Ahead
Litecoin continues to move in a downtrend and is expected to consolidate at the level above $100. If the price of Litecoin remains above $100, we may see some pullback action in the market towards $110 next week.
At present, Litecoin is expected to enter into a consolidation channel above the $100 handle. The on-balance volume is indicating a neutral market, and if the consolidation phase gets over, we may see some correction in LTCUSD.
The short-term outlook for Litecoin has turned strongly BEARISH; the medium-term outlook is NEUTRAL; and the long-term outlook is NEUTRAL at present market conditions.
This week, we are looking at levels of $100 to $110, and next week, Litecoin is expected to trade at levels above $100.
Technical Indicators:
The moving averages convergence divergence (12,26): at -0.76 indicating a SELL
Stoch (9,6): at 22.26 indicating a SELL
The rate of price change: at -5.87 indicating a SELL
The average direction change (14-day): at 51.99 indicating a SELL
FXOpen offers the world's most popular cryptocurrency CFDs*, including Bitcoin and Ethereum. Floating spreads, 1:2 leverage — at your service (additional fees may apply). Open your trading account now or learn more about crypto CFD trading with FXOpen.
*Important: At FXOpen UK, Cryptocurrency trading via CFDs is only available to our Professional clients. They are not available for trading by Retail clients. To find out more information about how this may affect you, please get in touch with our team.
This article represents the opinion of the Companies operating under the FXOpen brand only. It is not to be construed as an offer, solicitation, or recommendation with respect to products and services provided by the Companies operating under the FXOpen brand, nor is it to be considered financial advice.
Stay ahead of the market!
Subscribe now to our mailing list and receive the latest market news and insights delivered directly to your inbox.


Latest articles

AUD/USD: Will the RBA Be Able to Keep Its Currency Strong?
As the chart shows, AUD/USD has entered a distinctly bearish phase in recent weeks, reflecting the broader consolidation — and in some cases outright weakness — that the US dollar has begun imposing across most major currency pairs.
Fundamental Analysis
The

AUD/CAD: Pair Remains Range-Bound Amid Interest Rate Divergence
The key macroeconomic factor for AUD/CAD remains the divergence in monetary policy between the two central banks. After three consecutive rate hikes since the beginning of the year, the Reserve Bank of Australia left its cash rate unchanged at

Brent Crude Oil Analysis: Stabilisation or Simply a Pause?
Over the past few weeks, financial markets have been more focused than ever on developments surrounding the Strait of Hormuz — a critical waterway at the centre of ongoing US-Iran negotiations. The back-and-forth of diplomatic headlines has injected significant volatility into