


ETHUSD and LTCUSD Technical Analysis – 07th OCT, 2021
FXOpen

ETHUSD: Ether Above $3500
Ethereum is moving in a strong bullish momentum after crossing the $3500 handle, and any dip is reinforced with fresh buying pressure in ETHUSD. ETH is now on its path towards crossing the Fibonacci resistance levels of $3615 and classic resistance levels of $3644 today.
Ether is expected to maintain the bullish tone this week and continue towards the $4000 mark as the bulls take over. Today in the Asian trading session ETHUSD touched an intraday low of $3470.
ETH is now moving above both the 100 hourly and 200 hourly moving average. After reaching the $3600 level, prices are expected to consolidate towards $3550.
- Ethereum is on a bullish run towards $3750
- Short term to Medium term outlook remains bullish.
- Staying above both the 100 hourly simple and exponential moving averages
- The ETHUSD is expected to cross $3850 in the opening of next week.
Ether Uptrend Channel Formations
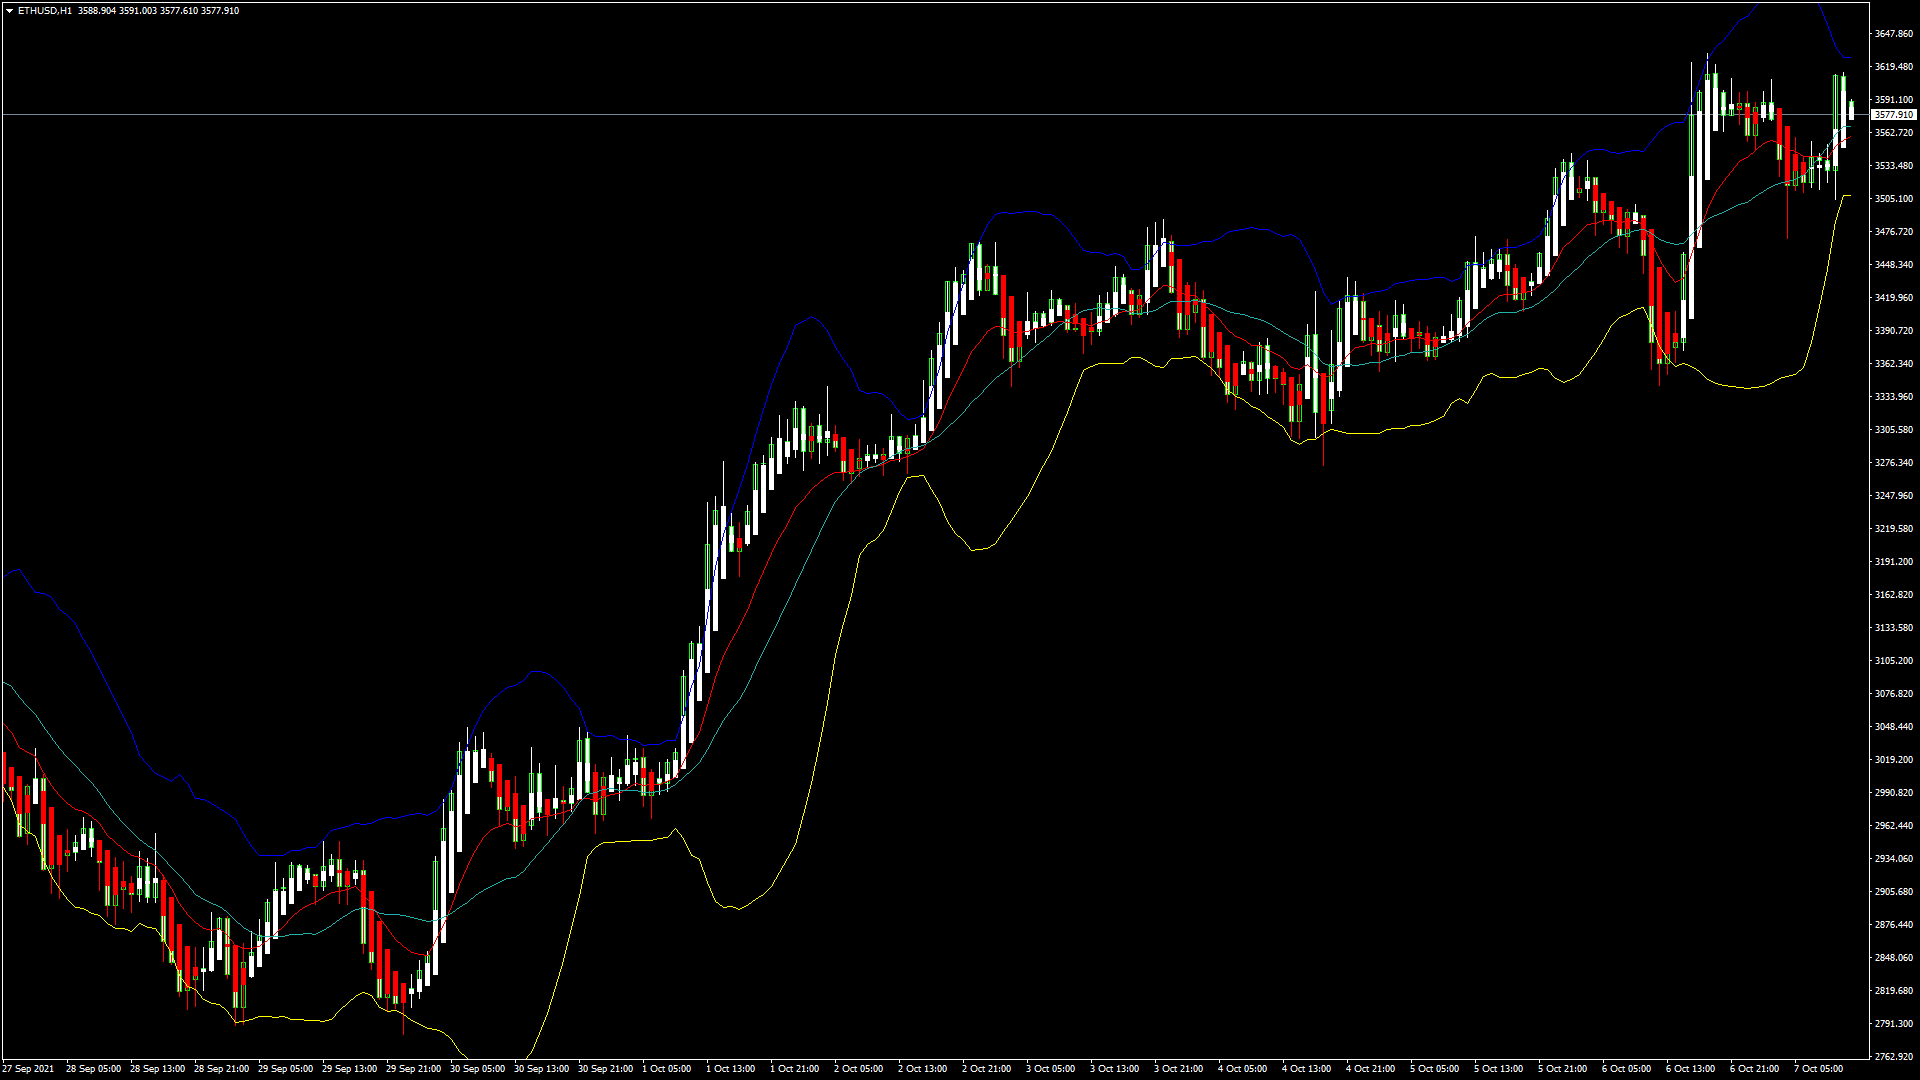
ETHUSD is moving in uptrend channel formations by staying above the $3500 levels. Ethereum is now on its path towards $3600 after clearing the 50-day moving average of $3500.82. The volatility in ETHUSD is lower today, and more trading volumes could be seen this week.
ETH gained 5.73% with a price change of +$196.88 in the past 24hrs, and has a trading volume of 22.478 billion USD.
The Week Ahead
Ethereum is moving in a bullish tone this week, and any dips are well supported, pushing its prices above the $3500 mark. A short-term correction is expected once the price reaches $3600 after which the path towards $4000 will be cleared.
Since the average direction change (14-day) is neutral, ETHUSD may enter into a consolidation or correction phase at any time; but the renewed buying pressure that is seen will steer its prices above $3600 today in the US trading session.
This week, ETH is expected to close above the $3800 level, and the trend will continue in the opening of the next week.
Technical Indicators:
StochRSI (9,6): at 63.86 indicating a BUY
Moving averages convergence divergence (14-day): at 18.72 indicating a BUY
Ultimate oscillator: at 61.79 indicating a BUY
Bulls/Bears power (13-day): at 18.187 indicating a BUY
LTCUSD – Bullish Divergence Pattern Above $160
Litecoin is currently trading above the $180 handle in the European trading session. It has already crossed its 100 hourly and 200 hourly moving averages. After touching an intraday low of $173.45 in the Asian trading session today, it gained traction, and buying support was seen pushing its prices well above the $185 mark. All the major technical indicators and moving averages are signaling a STRONG BUY at current market prices.
Litecoin is now facing its classic resistance levels of 187 and Fibonacci resistance levels of 186.65 in the European trading session. Both the short term and medium term outlook for Litecoin appears bullish, and the 100-day moving average indicates a STRONG BUY.
- Average direction change (14-day) and ultimate oscillator are both indicating a BUY at the current market levels of $182.20
- Bullish trend line formation above the $173 handle
- Simple and exponential moving averages indicate a STRONG BUY
- Dips remain well supported above the $170 mark
Litecoin Bullish Trend Line Formations
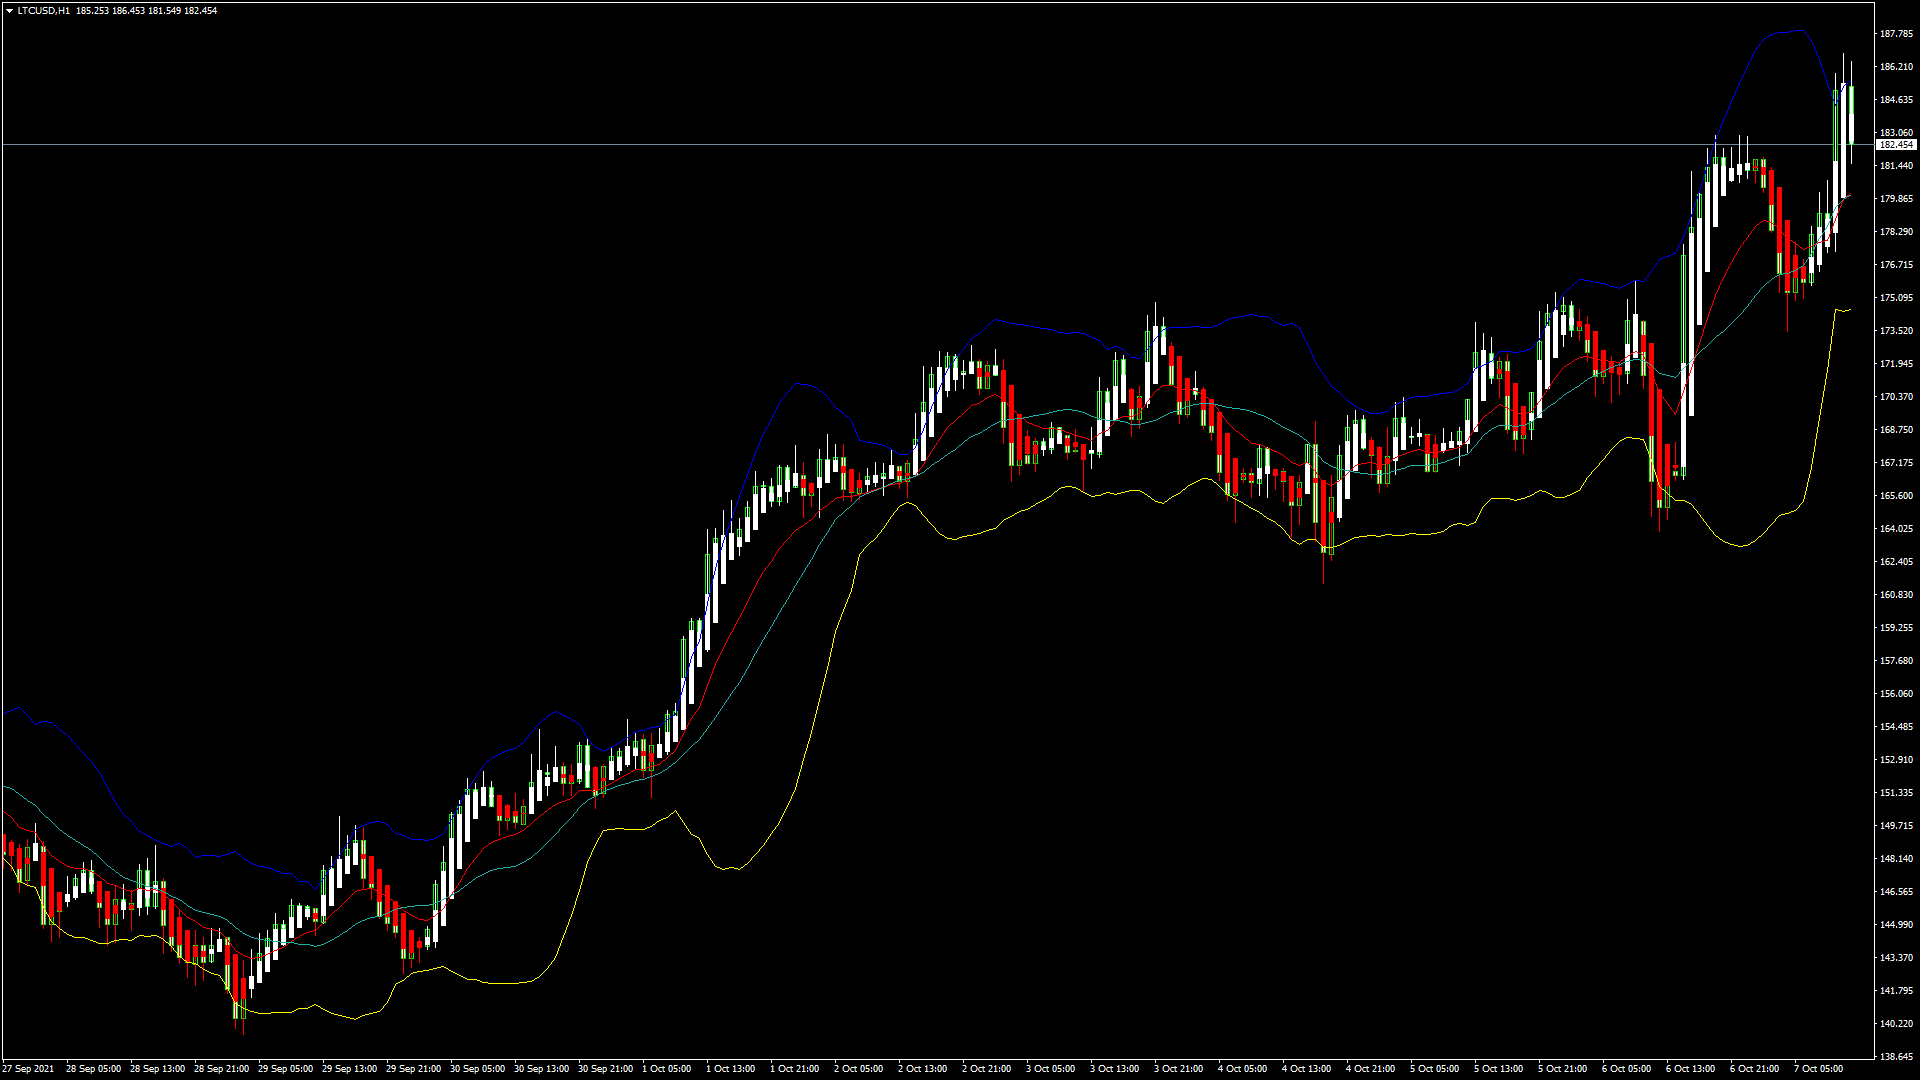
LTCUSD is moving in a bullish divergence pattern above $160, and there is no selling pressure seen below these levels.
Litecoin price has been on a bullish momentum today and is now facing its Camarilla resistance levels of 185.70 and a DeMark resistance level of 187.60.
Litecoin is trading with high market volatility today. It touched an intraday high of 186.85 in the London trading session. In the last 24hrs, LTCUSD has grown by +10.60% at +17.49$, and has a 24hr trading volume of USD 3.874 Billion.
The Week Ahead
Litecoin was moving in consolidation at the start of this week. But now, bullish trend line formation is seen above the $173 level, indicating that the prices can go much higher than the current market levels in the medium term.
It is expected to reach $187.50 as immediate targets this week and later are moving towards the 190-195 handle.
Technical Indicators:
Rate of price change: at 0.660 with a BUY
Commodity channel index (14-day): at 100.77 with a BUY
Moving averages convergence divergence (12,26): at 2.149 with a BUY
Average true range (14-day): indicating high volatility
FXOpen offers the world's most popular cryptocurrency CFDs*, including Bitcoin and Ethereum. Floating spreads, 1:2 leverage — at your service (additional fees may apply). Open your trading account now or learn more about crypto CFD trading with FXOpen.
*Important: At FXOpen UK, Cryptocurrency trading via CFDs is only available to our Professional clients. They are not available for trading by Retail clients. To find out more information about how this may affect you, please get in touch with our team.
This article represents the opinion of the Companies operating under the FXOpen brand only. It is not to be construed as an offer, solicitation, or recommendation with respect to products and services provided by the Companies operating under the FXOpen brand, nor is it to be considered financial advice.
Stay ahead of the market!
Subscribe now to our mailing list and receive the latest market news and insights delivered directly to your inbox.


Latest articles

AUD/USD: Will the RBA Be Able to Keep Its Currency Strong?
As the chart shows, AUD/USD has entered a distinctly bearish phase in recent weeks, reflecting the broader consolidation — and in some cases outright weakness — that the US dollar has begun imposing across most major currency pairs.
Fundamental Analysis
The

AUD/CAD: Pair Remains Range-Bound Amid Interest Rate Divergence
The key macroeconomic factor for AUD/CAD remains the divergence in monetary policy between the two central banks. After three consecutive rate hikes since the beginning of the year, the Reserve Bank of Australia left its cash rate unchanged at

Brent Crude Oil Analysis: Stabilisation or Simply a Pause?
Over the past few weeks, financial markets have been more focused than ever on developments surrounding the Strait of Hormuz — a critical waterway at the centre of ongoing US-Iran negotiations. The back-and-forth of diplomatic headlines has injected significant volatility into