


FXOpen

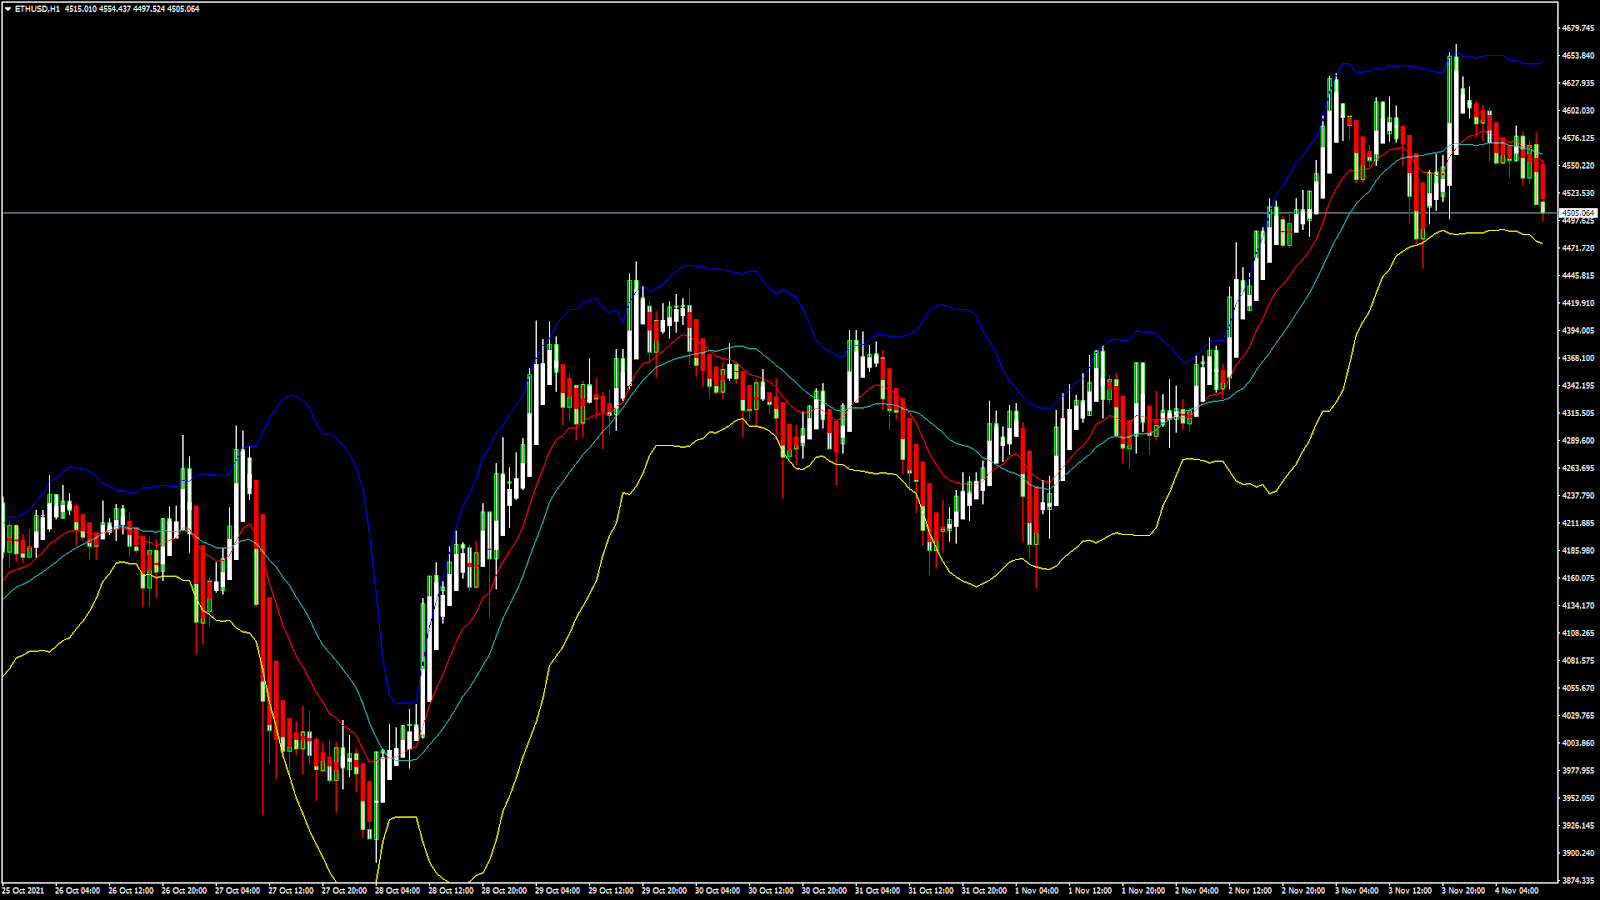
ETHUSD: Bearish Engulfing Pattern Below $4,600
Ethereum has started bearish correction today in the Asian trading session, and the prices continue to break down below the $4,550 level with more downsides. We can see a bearish engulfing pattern below the $4,600 handle which signifies a bearing short-term trend reversal.
ETHUSD touched an intraday high of $4,661 yesterday in the US trading session after which the prices saw a downward correction of more than 4%, touching an intraday low of $4,509 today in the European trading session.
ETH is now trading below its classic support level of $4,544 and Camarilla support level of $4,564. ETH is gaining a bearish downtrend today and is about to break its classic resistance level of $4,057.
Ether is following a bearish path below $4,600 against the US dollar. No recovery seen today as the upsides remain limited and more selling pressure is seen below the $4,550 level.
The bearish correction is expected to continue, and the prices can break the important support levels of $42,00 in the coming days.
All the major technical indicators are giving a STRONG SELL signal.
ETH is now trading just above its 100 hourly simple and exponential moving averages.
- Ethereum extends its losses below $4,600 with more downsides
- Short-term range appears to be bearish for ETHUSD
- Average true range indicates less market volatility
- Relative strength index is NEUTRAL
Ether Could Extend Losses Below $4,400
ETHUSD made an unsuccessful attempt towards the $4,700 level, after which ETH started its decline below $4,550. The selling pressure has increased today in the ETHUSD, and the next support levels of $4,400 and $4,350 will be tested in the coming week.
We will need to wait for the prices to enter into a consolidation phase after which the trend reversal is possible in the short-term range.
We can see a bearish trend line formation which is expected to touch sub-$4,300 level this week.
The relative strength index is at 45, indicating a NEUTRAL market, and we could see a range bound movement in the prices of ETHUSD in the US trading session today.
ETH lost 1.80% with a price change of +$74.12 in the past 24hrs, and has a trading volume of 20.477 billion USD.
The Week Ahead
Ethereum price has been moving in a downtrend since yesterday, and a short-term trend reversal is seen which is pushing the prices of ETHUSD down. ETHUSD may continue to extend its losses or enter into a consolidation phase at any time.
StochRSI is OVERSOLD which indicates that markets are going to enter into a consolidation phase soon.
We would need to wait before entering the markets at these levels in the short-term range.
The price of ETHUSD has already broken its pivot level of 4,559 and is now about to break its Woodie’s support level of 4,510.
Technical Indicators:
StochRSI (9,6): at 26.63 indicating a BUY
Average directional change (14-day): at 27.75 indicating a NEUTRAL level
Ultimate oscillator: at 40.03 indicating a BUY
Commodity channel index (14-day): at -101.59 indicating an OVERBOUGHT level
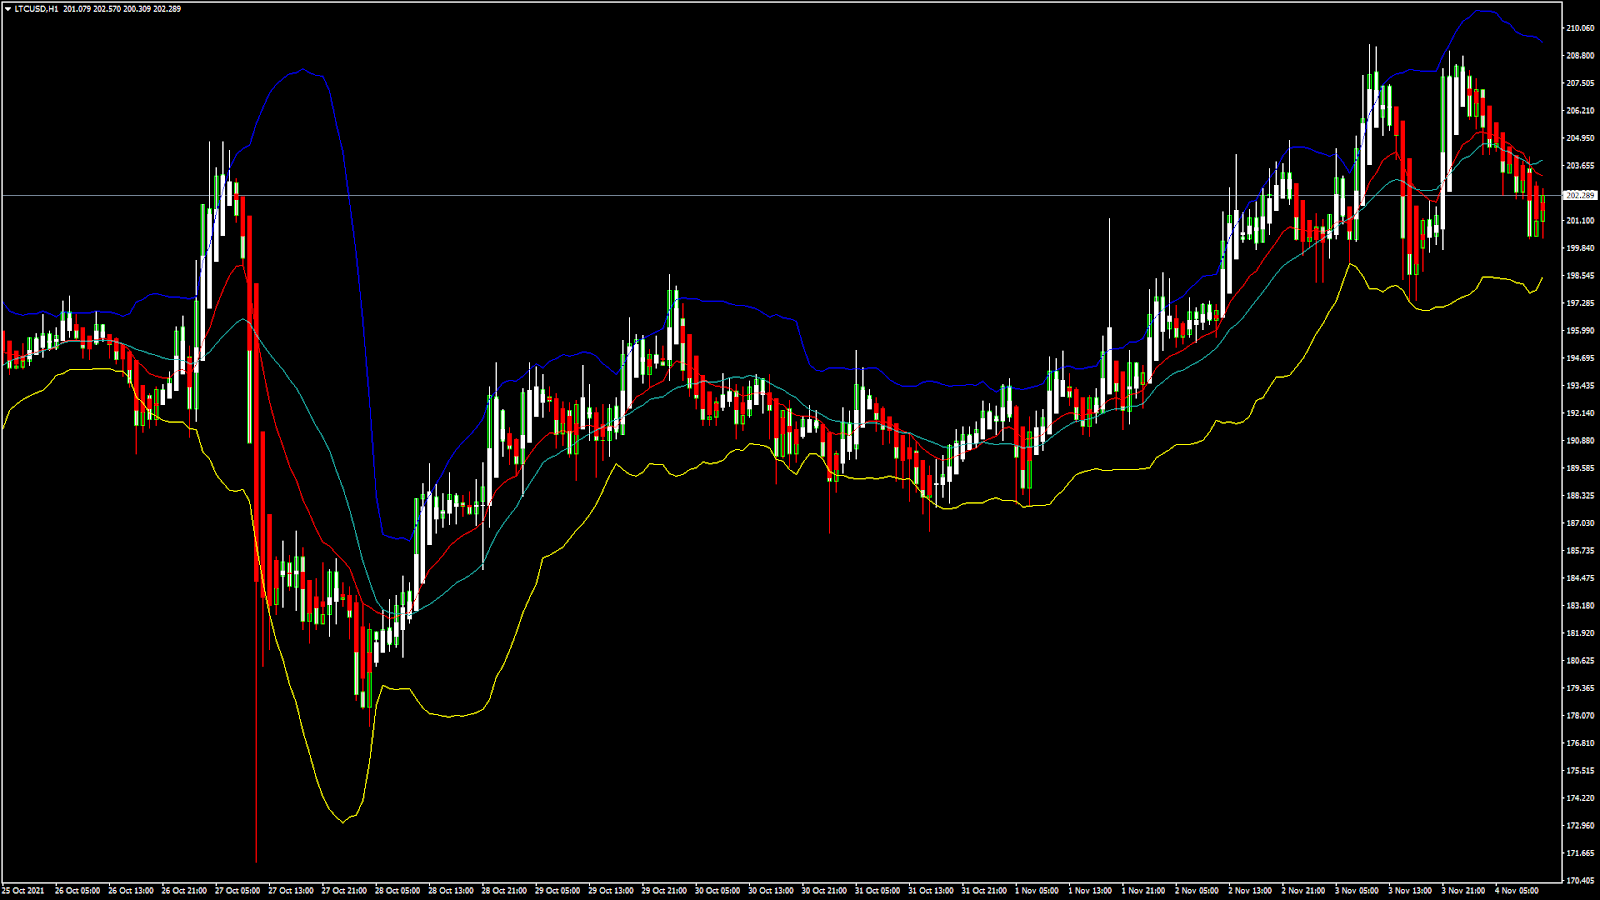
LTCUSD: Double Top Pattern Below $210
Litecoin started a major bearish correction yesterday and continues its downward slide today in the European trading session. The price of LTCUSD touched an intraday low of 200.25 and is expected to enter into a consolidation phase towards the $200 handle.
Litecoin is now trading above its 100 hourly simple and exponential moving averages. The price of LTCUSD is just about to break its pivot level of 201.40.
The sell-off that we saw yesterday continued today with a strong bearish tone which is expected to push LTCUSD below the $200 handle in the US trading session today.
We have seen a double top pattern below the $210 handle signifying a short-term bearish trend reversal towards sub-$200 levels. The medium to long-term outlook for Litecoin remains bullish.
- All the major tech indicators are giving a STRONG SELL signal
- Litecoin is now facing its major support level of $200
- Downtrend is seen in the short-term range
- Relative strength index is NEUTRAL
Litecoin Trend Reversal Below $210 Confirmed
The price of Litecoin is witnessing renewed selling pressure and is expected to break below the $200 handle at any time.
The price of LTCUSD is now facing its Camarilla support level of 200.34 and Fibonacci support level of 199.91 after which the path towards $190 will get cleared.
Litecoin is trading with less market volatility today and the prices are expected to enter into a consolidation phase. In the last 24hrs, LTCUSD has gone DOWN by -2.05% with a price change of -4.39$ and has a 24hr trading volume of 2.346 billion USD.
The Week Ahead
Litecoin broke its major support level of 203 and is moving in a string bearish momentum aiming for targets of $200 and $198 this week.
Further correction in the prices could force the markets to enter into a consolidation phase marking the end of the bearish pattern this week. But for now we will have to wait for Litecoin to remain above the important psychological support level of $200.
Average true range is indicating less market volatility and Williams percentage index is OVERSOLD.
We could witness levels of $198 to $195 this week, and next week, Litecoin is expected to trade at levels above $200.
Technical Indicators:
Ultimate oscillator: at 34.28 with a SELL
Rate of price change: at -2.843 with a SELL
Commodity channel index (14-day): at -120.10 indicating SELL.
Bull/Bear power (13-day): at -3.07 indicating a SELL
FXOpen offers the world's most popular cryptocurrency CFDs*, including Bitcoin and Ethereum. Floating spreads, 1:2 leverage — at your service. Open your trading account now or learn more about crypto CFD trading with FXOpen.
*At FXOpen UK and FXOpen AU, Cryptocurrency CFDs are only available for trading by those clients categorised as Professional clients under FCA Rules and Professional clients under ASIC Rules respectively. They are not available for trading by Retail clients.
This article represents the opinion of the Companies operating under the FXOpen brand only. It is not to be construed as an offer, solicitation, or recommendation with respect to products and services provided by the Companies operating under the FXOpen brand, nor is it to be considered financial advice.
Latest from Cryptocurrencies
Latest articles

Weekly Market Wrap With Gary Thomson: UK100, USD, GOLD, OIL
Get the latest scoop on the week's hottest headlines, all in one convenient video. Join Gary Thomson, the COO of FXOpen UK, as he breaks down the most significant news reports and shares his expert insights.
- UK100 Share Index Rises

What Is a Darvas Box Theory and How Does It Work in Trading?
The Darvas Box Theory, pioneered by Nicolas Darvas in the 1950s, has transcended its stock market origins to become a valuable tool for forex traders. This method leverages specific price movements and patterns, known as the Darvas Box, to track

NFLX Stock Price Falls Despite Subscriber Growth
Yesterday, after the close of the main trading session on the stock market, Netflix reported to investors for the 1st quarter of 2024.
The report turned out better than expected:
→ earnings per share: actual = USD 5.28, forecast = USD 4.