


ETHUSD and LTCUSD Technical Analysis – 03rd FEB, 2022
FXOpen
ETHUSD: Rounding Bottom Pattern Above $2,400
Ethereum has finished its bearish momentum seen last week after it touched a low of $2,183 on 24th January. In today’s European trading session, we can observe a mildly bullish trend, which is keeping ETH prices above the $2,600 handle.
ETHUSD continues to maintain its consolidation above $2,600, and is on a recovery mode towards its important resistance level of $3,000.
We can clearly see a rounding bottom pattern above the $2,400 handle which is a bullish pattern and signifies a bullish continuation forming an uptrend.
ETH is now trading just above its pivot level of $2,667, and is moving in a consolidation channel. The price of ETHUSD is now testing its classic resistance levels of $2,681, and Fibonacci resistance level of $2,689, after which the path towards $3,000 will get cleared.
The relative strength index is at 44 indicating a NEUTRAL market sentiment which is expected to continue for some time due to the global risk scenario.
Most of the technical indicators are giving a NEUTRAL market signal.
ETH is now trading above its 100 hourly and 200 hourly simple moving averages.
- Ether’s bullish momentum is seen above the $2400 mark
- Short-term range appears to be mildly BULLISH
- Williams percent range is indicating a NEUTRAL market
- Average true range is indicating LESS market volatility
Ether: Mild Bullish Momentum seen above $2,400

In today’s European trading session, ETHUSD continues to move in a mildly bullish channel above the $2,400 handle.
The commodity channel index is indicating a NEUTRAL market, and the overall sentiment has shifted towards the bullish market.
The selling pressure has subsided, and a buying zone formation is seen which continues to push the prices upwards after every decline.
We are looking at the important psychological resistance level of $3,000 which, if broken, will lead Ethereum into a strongly bullish momentum.
The key support level to watch is $2,600, and as we can see that the prices continue to remain above these levels.
ETH has lost -3.70% with a price change of -85.47$ in the past 24hrs, and has a trading volume of 14.684 billion USD.
We can see an increase of 17.17% in the total trading volume in the last 24 hrs, which appears to be normal.
The Week Ahead
Ethereum is now on track towards recovery after the recent decline last week. We saw ETHUSD touching a high of $3,268 on 20th January, and if the current bullish momentum continues, we could see these levels again the next week.
For now, the main contention is the falling interest of the global investors and the panic selling that is seen due to the tension at the Russia and Ukraine border.
If the prices of ETHUSD continue to remain above the $2,600 handle, as we have seen today, it will confirm the bullish channel formation with an upside target of $2,900 to $3,200 the next week.
The immediate short-term outlook for Ether has turned NEUTRAL, the medium-term outlook is mildly BULLISH, and the long-term outlook is BULLISH towards the $3,500 handle.
We have detected an MA 10 and MA 5 crossover pattern above $2,664, which signifies a bullish trend reversal in the short-term.
This week, Ether is expected to move in a range between $2,600 and $2,800; the next week, Ether is expected to trade at levels above $2,800.
Technical Indicators:
Ultimate oscillator: at 51.60 indicating a BUY
Average directional change (14-day): at 23.93 indicating a BUY
Highs/lows(14-day): at 0.00 indicating a NEUTRAL market
StochRSI (14-day): at 71.08 indicating a BUY
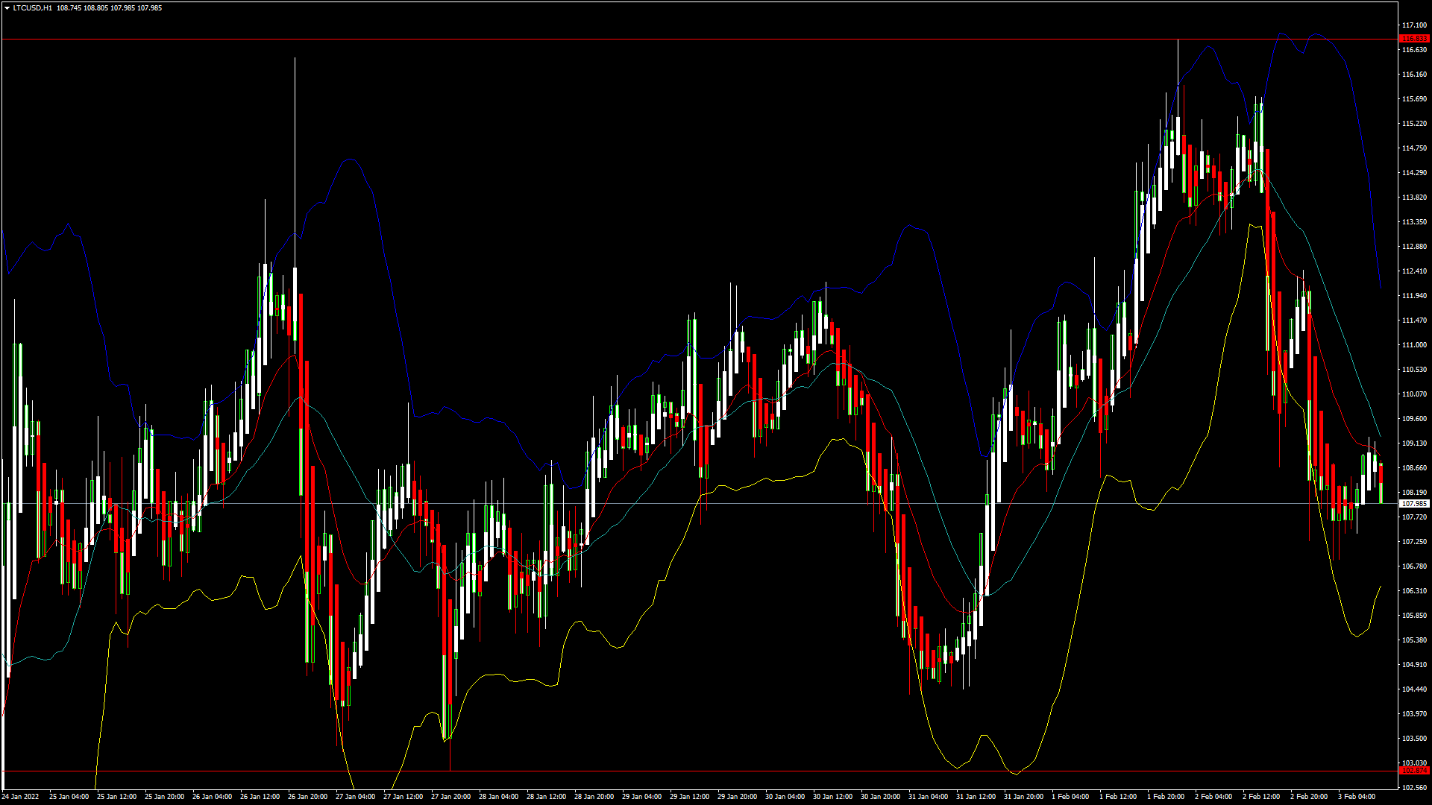
LTCUSD: Descending Triangle Pattern Below $116
Litecoin touched a high of 116.82 on 2nd February, after which we saw heavy selling pressure which continues to push down its prices below the $110 handle in today’s European trading session.
LTUCSD touched a low of 107.40 in the Asian trading session today and has now entered a consolidation zone above the $107 handle in the European trading session.
We can clearly see a descending triangle pattern below the $116 handle which is a bearish pattern and signifies a potential shift in the market direction towards a downtrend.
Litecoin is now trading below its 100 hourly simple moving average, and 200 hourly exponential moving averages. The price of LTCUSD is just below its pivot levels of 108.73.
The relative strength index is at 39 indicating a weak demand for Litecoin, and selling pressure from global crypto investors.
All of the moving averages are giving a STRONG SELL signal at the current market level of 108.02.
Both the Stoch and StochRSI are indicating a NEUTRAL market and a shift towards the consolidation zone formation.
The short-term outlook for Litecoin has turned BEARISH.
- Some of the major technical indicators are giving a SELL signal
- Bearish momentum is seen below $116
- Commodity channel index is indicating a NEUTRAL market
- Average true range is indicating LESS market volatility
Litecoin: Bearish Momentum Below $116 Continues
The price of Litecoin continues to decline against the US dollar and is now trading below the $110 handle. We can see a move towards the consolidation phase which is expected to keep its prices above the $105 handle.
The price of LTCUSD is now facing its classic support level of 107.36, and Fibonacci support level of 108.38, after which the path towards $105 will get cleared.
The commodity channel index is indicating a NEUTRAL market which means that in the short-term, the range bound movement is expected to continue.
In the last 24hrs LTCUSD has gone Down by -5.65% with a price change of -6.48$, and has a 24hr trading volume of 0.744 billion USD.
Litecoin trading volume has increased by 9.80% as compared to yesterday — which appears to be normal.
The Week Ahead
Litecoin has already entered into a consolidation channel above the $107 handle. If the prices of LTCUSD continue to remain above these levels then we can see a Bullish reversal in the markets in the next week.
The short-term outlook for Litecoin has turned as NEUTRAL, the medium-term outlook is BEARISH, and the long-term outlook is BULLISH at present market conditions.
This week, we are looking at levels of $105 to $110, and next week, Litecoin is expected to trade at levels above $110.
Litecoin Upgrade Launched
After 2 years, Litecoin has launched its much-anticipated upgrade of Mimblewimble. Mimblewimble is a privacy focused decentralization protocol, which will allow the users to conceal the transaction information over the LTC network. This is expected to increase more community-driven participation and increase the privacy of its transaction for the Litecoin users worldwide.
Mimblewimble is also expected to add fungibility and scalability — the key features that are currently lacking across many blockchains.
At present, Litecoin is ranked 21st among the worldwide cryptocurrencies, with a total market capitalization of 7.5bBillion USD.
Technical Indicators:
Moving averages convergence divergence (12,26): at -0.995 indicating a SELL
Williams percent range: at -77.77 indicating a SELL
Rate of price change: at -3.13 indicating a SELLUltimate oscillator: at 47.03 indicating a SELL
FXOpen offers the world's most popular cryptocurrency CFDs*, including Bitcoin and Ethereum. Floating spreads, 1:2 leverage — at your service (additional fees may apply). Open your trading account now or learn more about crypto CFD trading with FXOpen.
*Important: At FXOpen UK, Cryptocurrency trading via CFDs is only available to our Professional clients. They are not available for trading by Retail clients. To find out more information about how this may affect you, please get in touch with our team.
This article represents the opinion of the Companies operating under the FXOpen brand only. It is not to be construed as an offer, solicitation, or recommendation with respect to products and services provided by the Companies operating under the FXOpen brand, nor is it to be considered financial advice.
Stay ahead of the market!
Subscribe now to our mailing list and receive the latest market news and insights delivered directly to your inbox.


Latest articles

AUD/USD: Will the RBA Be Able to Keep Its Currency Strong?
As the chart shows, AUD/USD has entered a distinctly bearish phase in recent weeks, reflecting the broader consolidation — and in some cases outright weakness — that the US dollar has begun imposing across most major currency pairs.
Fundamental Analysis
The

AUD/CAD: Pair Remains Range-Bound Amid Interest Rate Divergence
The key macroeconomic factor for AUD/CAD remains the divergence in monetary policy between the two central banks. After three consecutive rate hikes since the beginning of the year, the Reserve Bank of Australia left its cash rate unchanged at

Brent Crude Oil Analysis: Stabilisation or Simply a Pause?
Over the past few weeks, financial markets have been more focused than ever on developments surrounding the Strait of Hormuz — a critical waterway at the centre of ongoing US-Iran negotiations. The back-and-forth of diplomatic headlines has injected significant volatility into